
Figure 7.
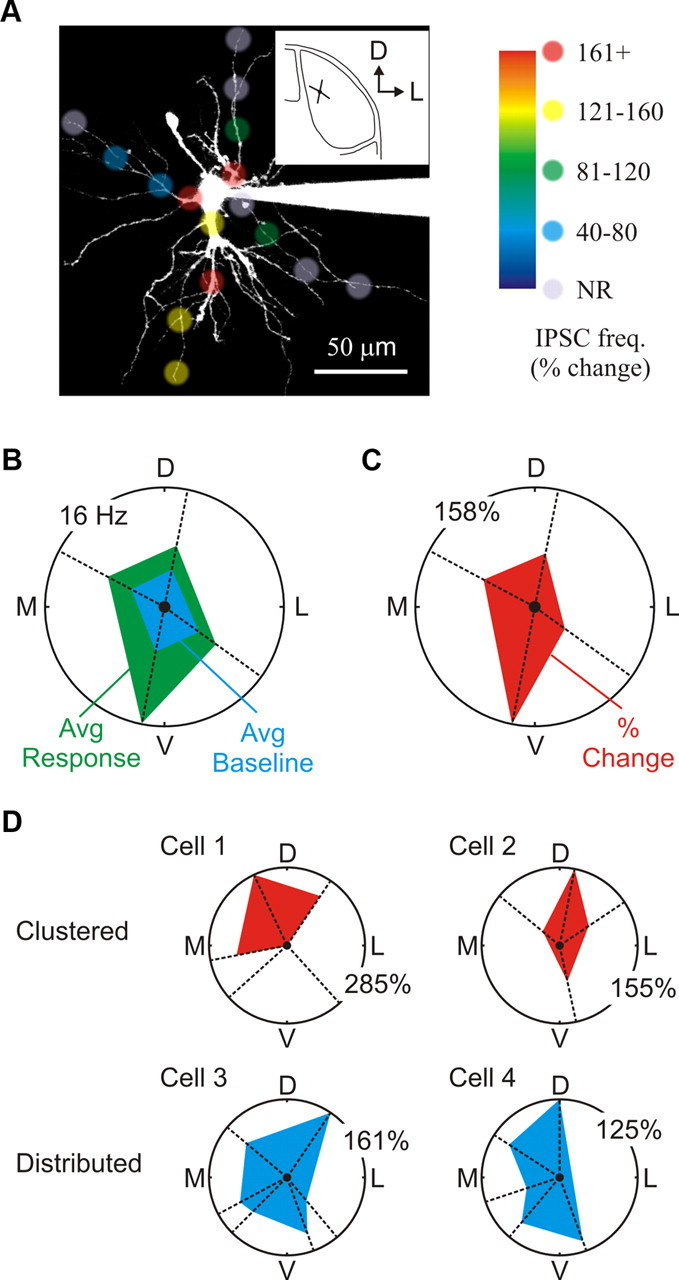
Distribution of dendrodendritic synapses across individual dLGN neurons. A, A 2PLSM image of a dLGN relay neuron filled with Alexa Fluor 594 (50 μm). The image illustrates the spatial distribution and response magnitude for each of the distinct locations tested from this neuron. Note that glutamate stimulation along one of the dendrites consistently evoked a robust change in IPSC activity independent of location. Stimulation along other dendrites produced either weak changes in IPSC activity or no response (NR) at all. The small inset shows both location and orientation of the cell within the dLGN (coronal plane) D, Dorsal; L, lateral. B, Polar plot of the four branches tested as a function of branch orientation [dorsal (D), lateral (L), ventral (V), and medial (M)]. Plotted are the average (Avg) baseline frequencies (blue) and glutamate evoked frequencies (green) for each dendrite. The average for each dendrite was calculated by combining the responses obtained from each of the four locations (three stimulations per location). C, Shown is a polar plot of the average change in IPSC frequency for each dendrite shown in B. A one-way ANOVA was used to compare dendrites across a single neuron. D, Top, Example of two dLGN neurons with clustered F2 innervation patterns (Cell 1 and Cell 2). Note that only three of the five dendrites examined in Cell 1 were innervated by F2 terminals. Bottom, Example of two dLGN neurons with distributed F2 innervation patterns (Cell 3 and Cell 4).