Figure 8.
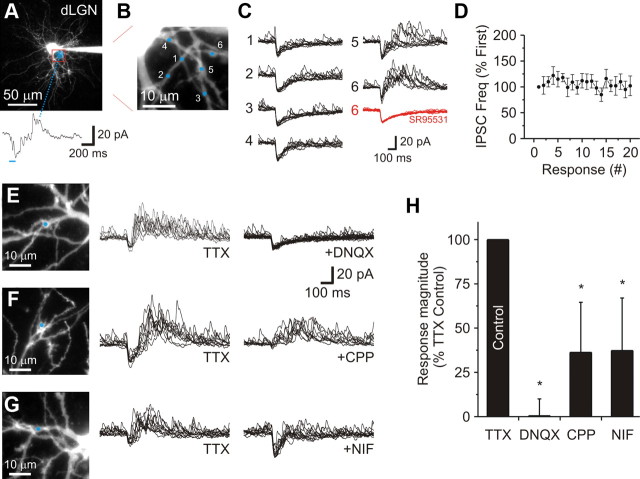
Focal glutamate uncaging reveals the mechanism behind local dendrodendritic output. A, A 2PLSM image of a dLGN relay neuron filled with Alexa Fluor 594 (50 μm). To use a more focal stimulation, we first used a long-duration laser pulse (blue shadow: 100 ms, low intensity) to locate a region innervated by F2 terminals. Bottom, In TTX (1 μm) a long stimulation produced a robust change in IPCS activity. B, A high resolution image indicating where focal glutamate uncaging (blue spots) was performed within the selected region shown in A. C, Ten random responses for the six locations are shown. Application of SR95531 (10 μm: red traces) attenuated the evoked IPSC activity at location 6. D, Population data (mean ± SEM) indicates that the increase in IPSC activity can be reliably obtained in consecutive trials (0.05 Hz interval). E, Left, A 2PLSM image of the region where focal uncaging was performed (Pulse: 1.0 ms). Middle, Ten random responses obtained in TTX (1 μm). Right, Subsequent addition of DNQX (20 μm) completely blocked the evoked IPSC activity. F, Left, A 2PLSM image of the region where focal uncaging was performed (Pulse: 0.1 ms). Middle, Ten random responses obtained in TTX (1 μm). Right, Subsequent addition of CPP (10 μm) significantly reduced the evoked IPSC activity and blocked the inward current. G, Left, A 2PLSM image of the region where focal uncaging was performed (Pulse: 2.0 ms). Middle, Ten random responses obtained in TTX (1 μm). Right, Subsequent addition of Nifedipine (NIF: 10 μm) significantly reduced the evoked IPSC activity. H, Population data summarizing the effect each receptor antagonist had on the evoked IPSC frequency. The asterisks indicate statistical significance.

