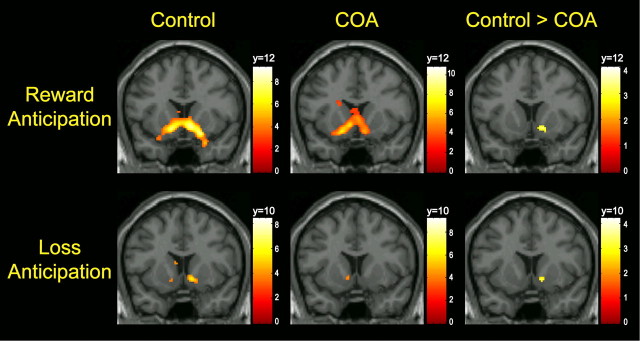
Figure 2.
Top row, Activation in VS during reward anticipation in control and COA groups and result of independent-sample t test of control > COA. Bottom row, Activation in VS during loss anticipation in control and COA groups and result of independent-sample t test of control > COA. Control and COA group activations are displayed at a threshold of p < 0.05 FDR-corrected. Coordinates of coronal slice displayed were selected based on the peak voxel within the VS in which control > COA. Color bars represent T scores.

