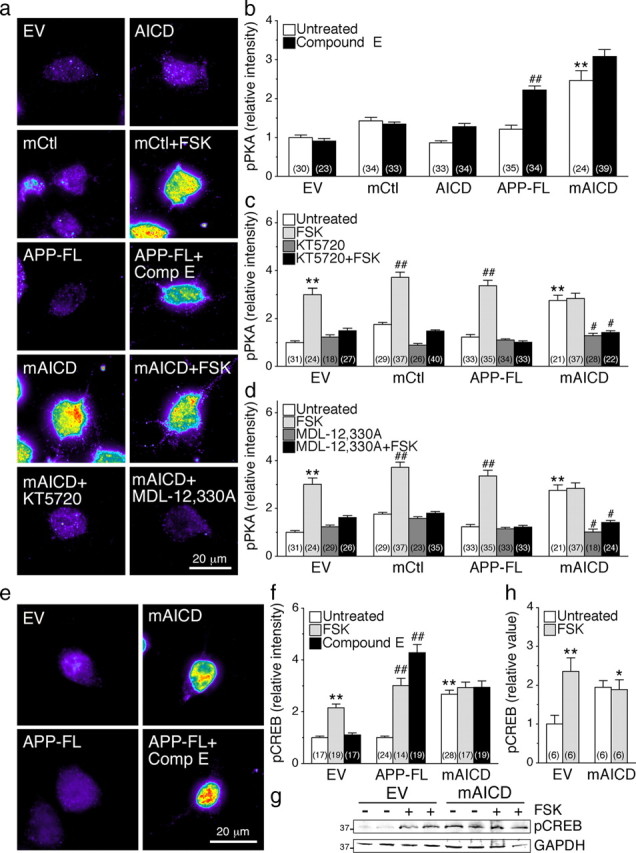
Figure 4.

Activation of cAMP/PKA pathway in N2a cells expressing membrane-tethered APP intracellular domain. N2a cells cotransfected with YFP and EV, mCtl, AICD, APP-FL, or mAICD were immunostained with phosphorylated Ser/Thr PKA substrate antibody (pPKA) (Grønborg et al., 2002) or phosphorylated (Ser133) CREB antibody (pCREB) (Ginty et al., 1993). a, Representative pseudocolor images of pPKA immunofluorescence staining intensity in treated or untreated cells expressing various constructs. b–d, Quantitative analysis of pPKA staining intensity. Changes in pPKA staining intensity following treatment with Compound E (10 nm; 24 h) (b), adenylate cyclase activator FSK (50 μm; 30 min) and PKA inhibitor KT5720 (2 μm; 30 min) (c), and adenylate cyclase inhibitor MDL-12,330A (10 nm; 30 min) (d) were plotted. e, Representative pseudocolor images of pCREB immunofluorescence in cells expressing EV, mAICD, or APP-FL. f, Changes in the levels of pCREB staining intensity under basal conditions and after treatment with FSK or Compound E are plotted. g, Representative Western blot of pCREB in stable N2a cells expressing EV or mAICD without or after FSK stimulation (50 μm; 30 min) is shown. GAPDH was used for loading control. h, Quantitative analysis is shown as relative change in the ratio of pCREB intensity over intensity of EV control. Statistical analysis was performed using ANOVA Kruskal–Wallis test followed by Dunn's post hoc multiple-comparison analysis. *p < 0.05, **p < 0.001, compared with untreated EV-transfected cells; and #p < 0.05, ##p < 0.001, compared with untreated cells within the same transfected conditions. The total number of quantified cells is shown in parentheses. Error bars indicate SEM.
