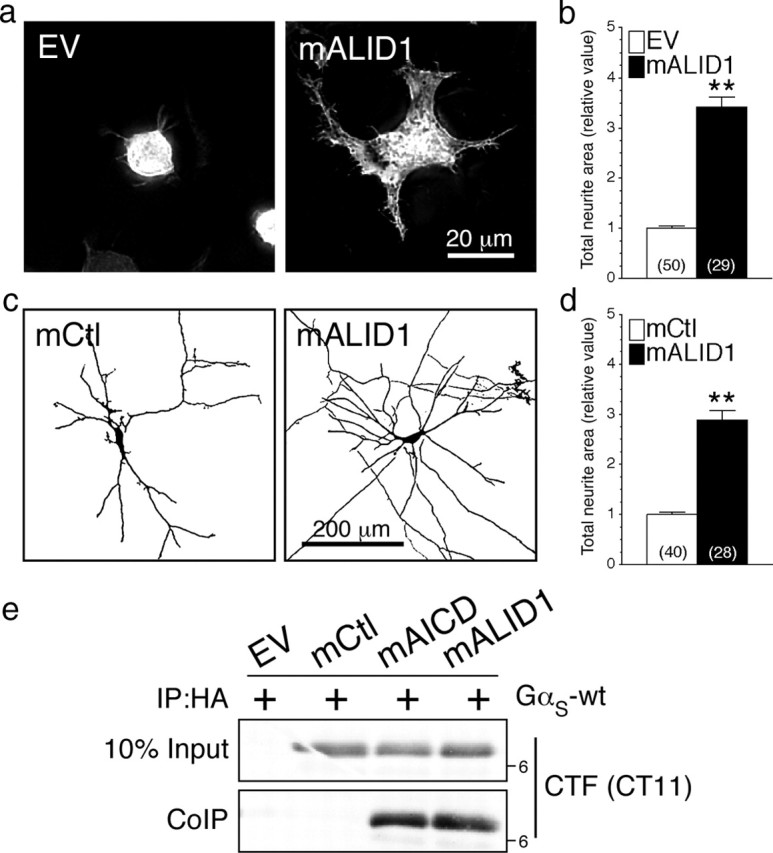
Figure 9.

Functional coupling of membrane-targeted APLP1 homolog with GαS-protein. N2a cells and cortical neurons were cotransfected with YFP and EV or mALID1. Representative images of N2a cells (a) or inverted images of 8 DIV cortical neurons (c) expressing EV, mCtl, or mALID1 are shown. b, d, Three-dimensional deconvolved images were quantified and morphological changes are plotted as relative difference of total neurite area compared with EV or mCtl as described in Materials and Methods. e, Coimmunoprecipitation analysis of mALID1 interaction with GαS was evaluated in N2a cells transiently cotransfected with EV, mCtl, mAICD, or mALID1 and GαS-wt. Non-denaturing lysates were immunoprecipitated with mAb HA and analyzed by immunoblotting with CT11 to detect tagged mAICD and mALID1. Statistical analysis was performed using ANOVA Kruskal–Wallis test followed by Dunn's post hoc multiple-comparison analysis. **p < 0.001, compared with EV- or mCtl-expressing cells. The total number of cells quantified, from three independent experiments, is shown in parentheses. Error bars indicate SEM.
