
Figure 4.
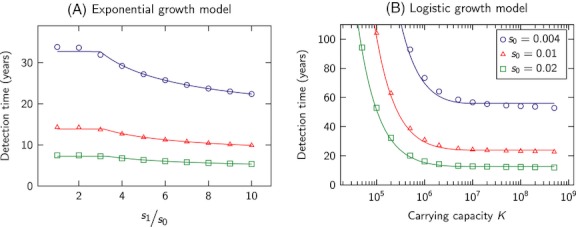
Comparison of analytical and simulation results for the expected time of tumor detection. Markers (circle, triangle, square) indicate simulation results while curves represent analytic predictions. In the exponential model (A), we observe that, for typical mutation rates, the additional driver needs to have a three times higher growth coefficient in order for the mutant type to accelerate tumor progression prior to detection. In the logistic growth model (B), the additional driver mutation is neutral ( ). We see that small carrying capacities (with αKu < 1) significantly slow tumor progression, while large carrying capacities (αKu > 1) have little effect. Simulation results are averages over
  runs. Parameter values: detection size
  cells, driver mutation rate
  , average cell division time is 3 days.