
Figure 7.
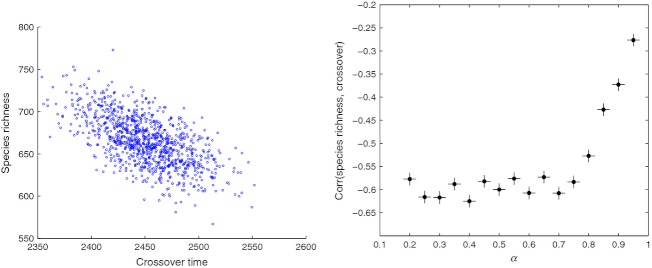
Correlations between the crossover time and the diversity of relapsed tumor. Left: low α case: α=0.3, correlation coefficient −0.62, and (right) plot of correlation coefficient between crossover time and diversity of relapsed tumor, for a spectrum of α (mutation rates). Parameters:  (as dictated by choice of α). Mutational fitness landscape U([0,0.001]).