
Figure 3.
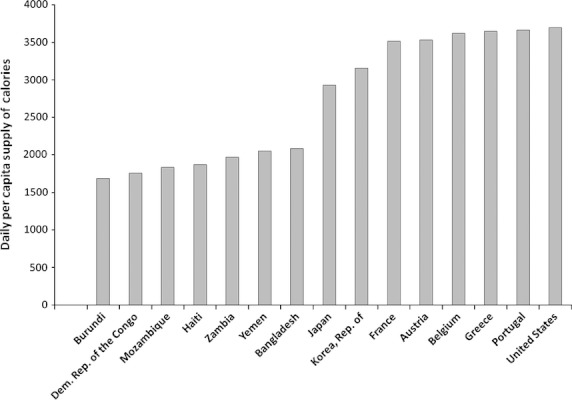
Daily per capita supply of calories, which represents the available calorie supply averaged across the population (United Nations Development Programme 2000).
Official websites use .gov
A
.gov website belongs to an official
government organization in the United States.
Secure .gov websites use HTTPS
A lock (
) or https:// means you've safely
connected to the .gov website. Share sensitive
information only on official, secure websites.
Daily per capita supply of calories, which represents the available calorie supply averaged across the population (United Nations Development Programme 2000).