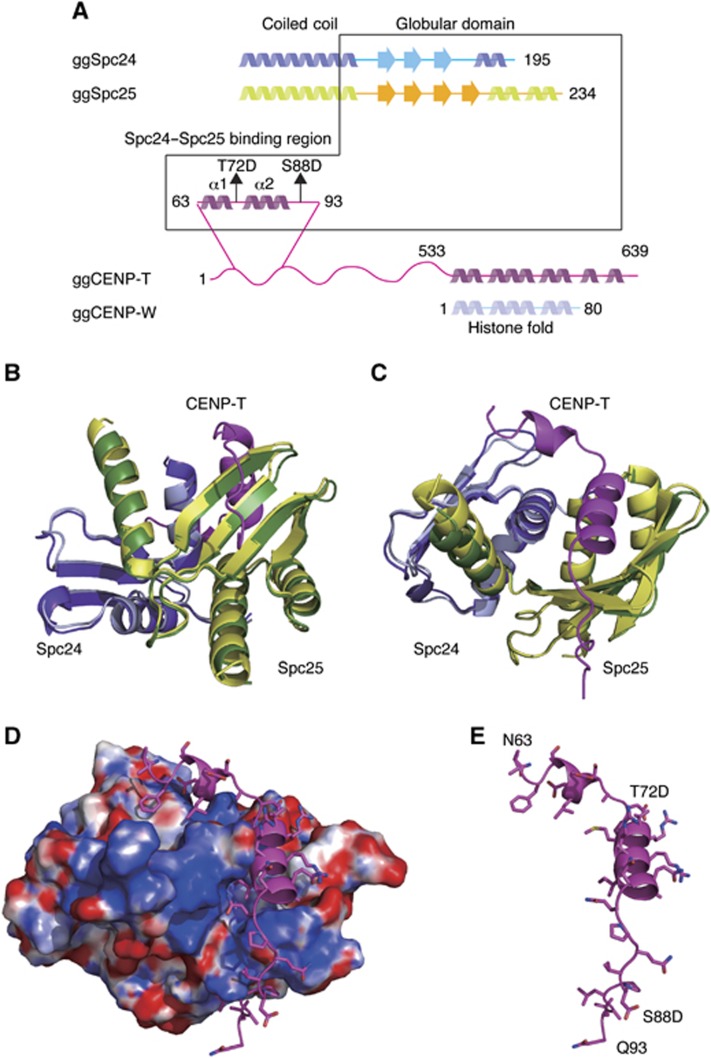
Figure 3.
Crystal structure of the phospho-mimetic CENP-T–Spc24/25 complex. (A) Schematic diagram of Spc24, Spc25, CENP-T, and CENP-W showing the presence of α-helices and β-sheets. The expression constructs used for the structural analyses are indicated by the box. (B) Structural model showing the side view of the Spc24/25 complex superimposed with the CENP-T–Spc24/25 complex. For the Spc24/25 complex, Spc24 is coloured in light cyan and Spc25 is in light green. For the CENP-T–Spc24/25 complex, CENP-T is coloured in magenta, Spc24 is cyan, and Spc25 is green. (C) Structural model showing the top view of the superimposed structures of the Spc24/25 complex and the CENP-T–Spc24/25 complex as in (B). (D) Structural model showing the surface charge of the Spc24/25 complex interacting with phospho-mimetic CENP-T peptide. Electrostatic surface charges of the Spc24/25 complex were calculated by APBS and are contoured from −8.0 (red) to 8.0 (blue). The complex is viewed from the same angle as in (C). Side chains of CENP-T are shown as stick models. (E) Structural model showing the phospho-mimetic CENP-T peptide from the CENP-T–Spc24/25 complex structure in (D) on its own.

