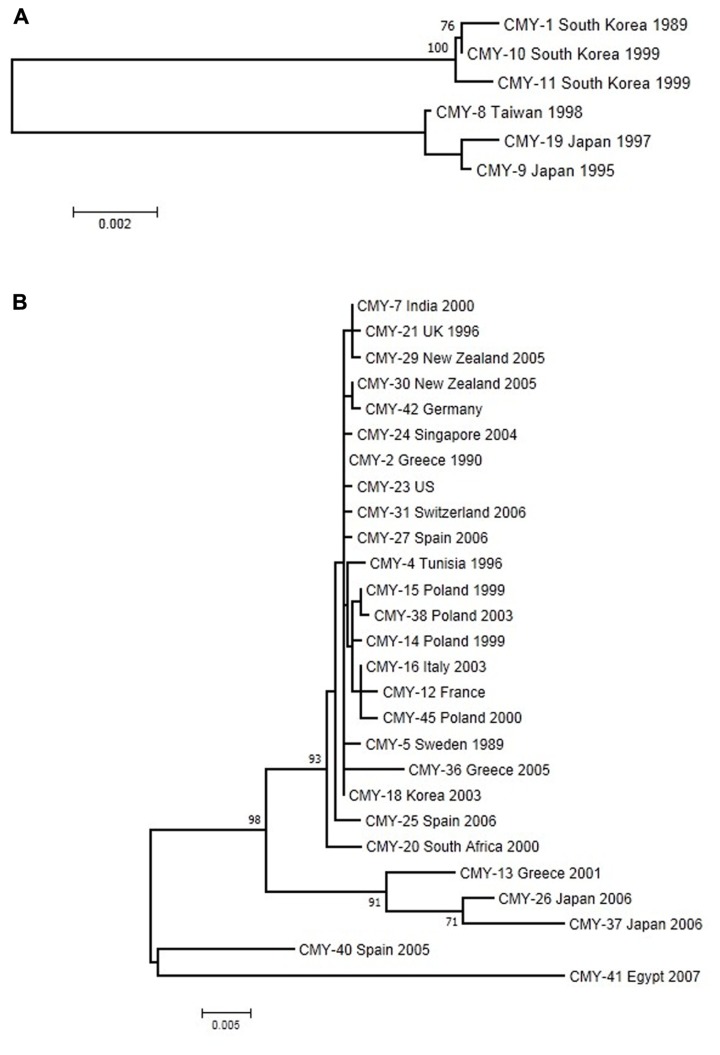
FIGURE 3.
Maximum-likelihood tree of CMY genes obtained with the Tamura-3P + G model of evolution. (A) The upper tree corresponds to CMY-1 group. (B) The lower one to the CMY-2 group of sequences. Multiple sequence alignments were obtained using the corresponding amino acid sequences with Muscle (Edgar, 2004a,b). Maximum-likelihood trees were obtained using the most appropriate model of evolution resulting from the comparison of Bayesian Information Criterion (BIC) values for 24 alternative models including gamma-distributed heterogeneous rates of evolution among and invariant sites. Support of the inferred clusters was evaluated with 1000 bootstrap replicates, BS values >70% are indicated. All these methods were used as implemented in MEGA 5 (Tamura et al., 2011). The scale bar corresponds to substitutions/site. Detection of positive selection and neutrality tests were performed as described in Figure 2.

