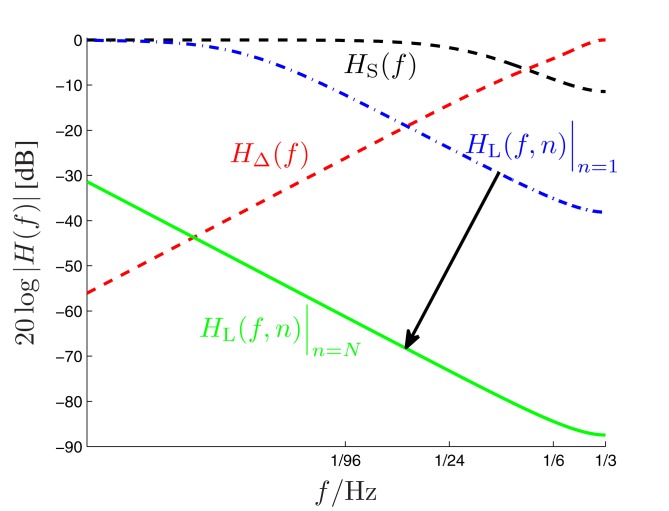
Figure 4.
Amplitude responses of the long-term (HL(f,n), dash-dotted and solid low-pass curves), short-term (HS(f ), dashed low-pass curve) and alternation (HΔ(f ), dashed high-pass curve) filters of the DIF model as a function of the input signal frequency f (logarithmic scale!). The dynamic long-term filter (dash-dotted and solid curves) is shown for n = 1 and n = N = 192.

