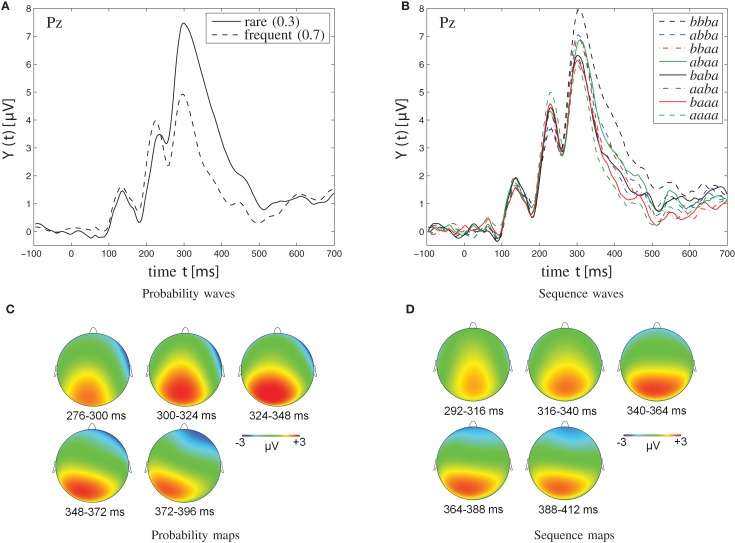
Figure 5.
Grand-average waveforms (A,B) and topographic maps (C,D) of P300 amplitudes. (A,C) Probability effect on P300 amplitudes in the [0.3, 0.7] probability category. (C) The probability maps show the scalp topography of the rare-frequent difference wave in the [0.3, 0.7] probability category at various points in time (276–396 ms, divided into five windows of 24 ms each). (B,D) Sequence effect on P300 amplitudes in the [0.5, 0.5] probability category. Note that sequences of four successive stimuli are illustrated; a signifies a particular stimulus (b the other one). Note further that the two solid traces, originating from the abaa and the baba sequences, respectively, show reversed P300 amplitudes. Specifically, for the single -b- sequence abaa, the P300 waveform lies amongst those from dual -bb- sequences, whereas for the dual -bb- sequence baba, the P300 waveform appears indistinguishable from the waveforms from single -b- sequences. As further detailed in the Discussion, this amplitude reversal is attributed to the disconfirmation of alternation expectation in the abaa sequence, was well as to the confirmation of alternation expectation in the baba sequence. (D) Sequence maps show the scalp topography of the bbba-aaaa difference wave in the [0.5, 0.5] probability category at various points in time (292–412 ms, divided into five time windows of 24 ms each).

