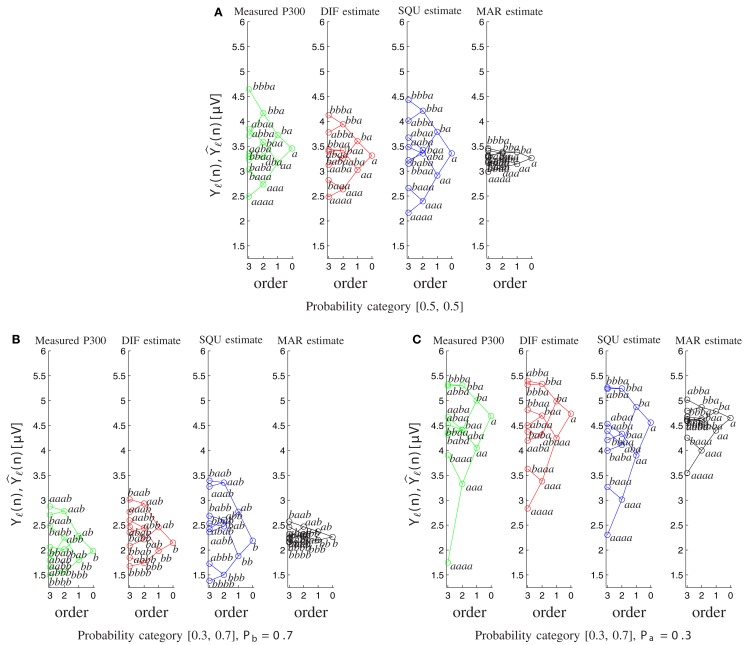
Figure 8.
Tree diagrams of measured P300 estimates Yℓ(n) and model-based P300 estimates as a function of the sequence of preceding stimuli. Within each order (0–3), the stimulus sequence is labeled, and related sequences are connected by lines. (A) For both stimuli on probability category [0.5, 0.5]. (B) For the frequently occurring stimulus b on probability category [0.3, 0.7]. (C) For the rarely occurring stimulus a on probability category [0.3, 0.7].

