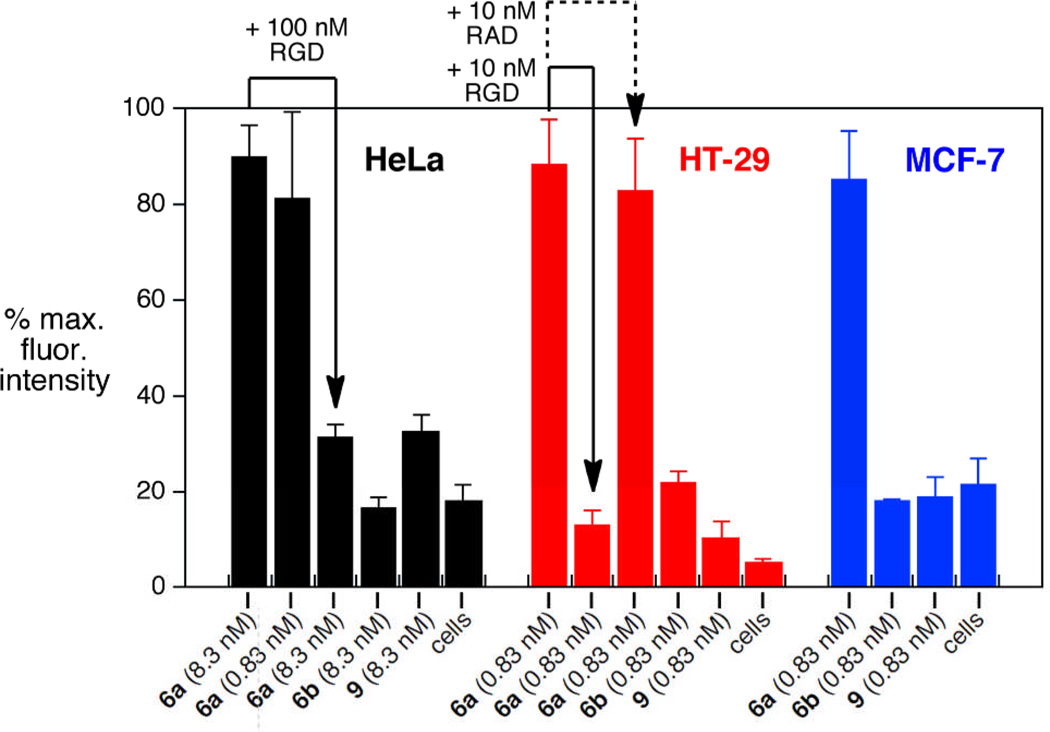
Figure 6.
Flow cytometry of mixtures of the indicated cells (5 × 10⁶ cells per mL) with various CPMV formulations, 37°C, 1 h, with detection by immunostaining for CPMV particles. Statistical analysis of data was performed with FlowJo software; error bars show standard deviation in averaged mean fluorescence intensity for three independent experiments. 100% values for fluorescence intensity: HeLa = 620, HT-29 = 1800, MCF-7 = 900. Added peptides: “RGD” = cyclo(RGDfMeK); “RAD” = cyclo(RβADfK).

