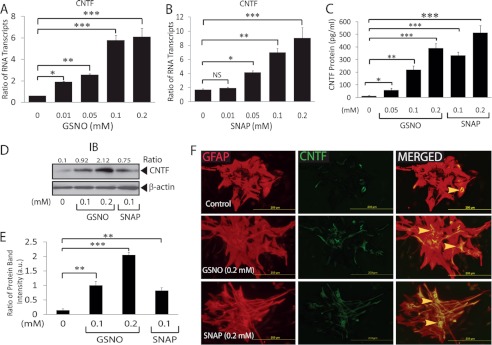
FIGURE 2.

S-Nitrosothiols induce CNTF expression in astrocytes. Cortical astrocytes were cultured as detailed in Fig. 1 legend and treated with GSNO or SNAP. A and B, the composite mean ± S.E. of four experiments of treated astrocytes for 24 h depicts the ratio of CNTF to β-actin mRNA transcripts. C, the composite mean ± S.E. of three experiments depicts CNTF levels in the culture supernatants of treated astrocytes for 48 h measured by ELISA. A representative autoradiograph (D) and composite mean ± S.E. of three experiments depict the ratio of CNTF to β-actin band intensity (arbitrary units (a.u.)) in treated astrocytes (E) for 48 h. F, a representative field of slides (n = 5) of treated astrocytes for 72 h depicts the immunofluorescence for GFAP (left panel), CNTF (middle panel), and their co-localization (right panel) examined with fluorescence microscope (magnification ×400). The arrowhead depicts the localization of CNTF in the cytoplasm of astrocytes. Statistical significance as indicated. *, p < 0.05; **, p < 0.01; ***, p < 0.001; NS, not significant; IB, immunoblot.
