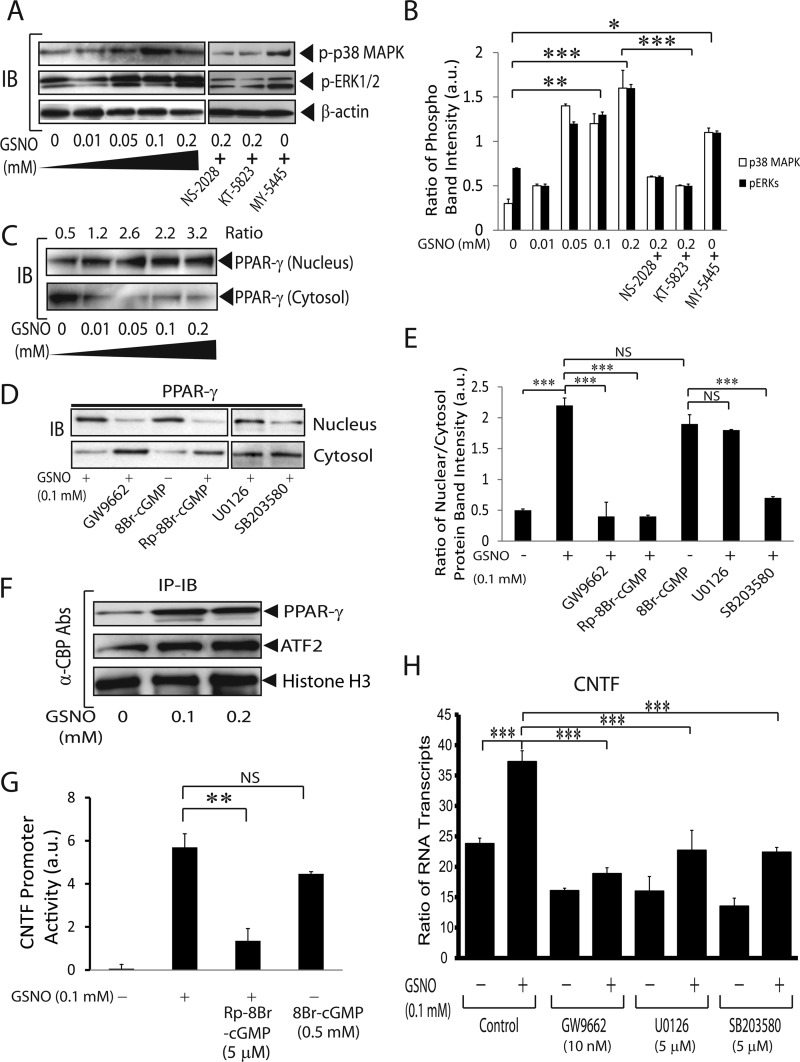
FIGURE 4.
GSNO-mediated activation of CREB/PPAR-γ/ATF2 induces CNTF gene in astrocytes. Cortical astrocytes were cultured in 6-well cell culture plates as detailed in the Fig. 1 legend. A, a representative autoradiograph depicts the phosphorylation of ERK1/2 and p38 MAPK in astrocytes treated with graded concentrations of GSNO and/or in the presence of NS-2028 (100 nm), KT-5823 (50 nm), and/or MY-5445 (5 μm) for 2 h. IB, immunoblot. B, the composite mean ± S.E. of three experiments depicts the ratio of phosphorylated to β-actin protein band intensity in treated astrocytes (A). a.u., arbitrary units. C and D, the representative autoradiograph depicts the distribution of PPAR-γ in the nucleus and cytosol of astrocytes treated with graded concentrations of GSNO and/or in the presence of GW9662 (100 nm), 8Br-cGMP (0.5 mm), Rp-8Br-cGMP (5 μm), U0126 (5 μm), and SB203580 (5 μm) for 24 h. E, the composite mean ± S.E. of three experiments depicts the ratio of PPAR-γ protein bands intensity in nucleus to cytosol in treated astrocytes (C and D). F, a representative autoradiograph depicts the level of PPAR-γ and ATF2 protein in the nucleus of treated astrocytes for 24 h analyzed by co-immunoprecipitation (IP) and Western blot analysis. G, the composite mean ± S.E. of four experiments depicts CNTF gene promoter activity normalized with GAPDH gene promoter activity in astrocytes treated with different concentrations of GSNO for 24 h analyzed by ChIP assay. H, the composite mean ± S.E. of four experiments depicts the ratio of CNTF to β-actin mRNA transcripts in treated astrocytes for 24 h. Statistical significance as indicated. *, p < 0.05; **, p < 0.01; ***, p < 0.001. NS, no treatment.

