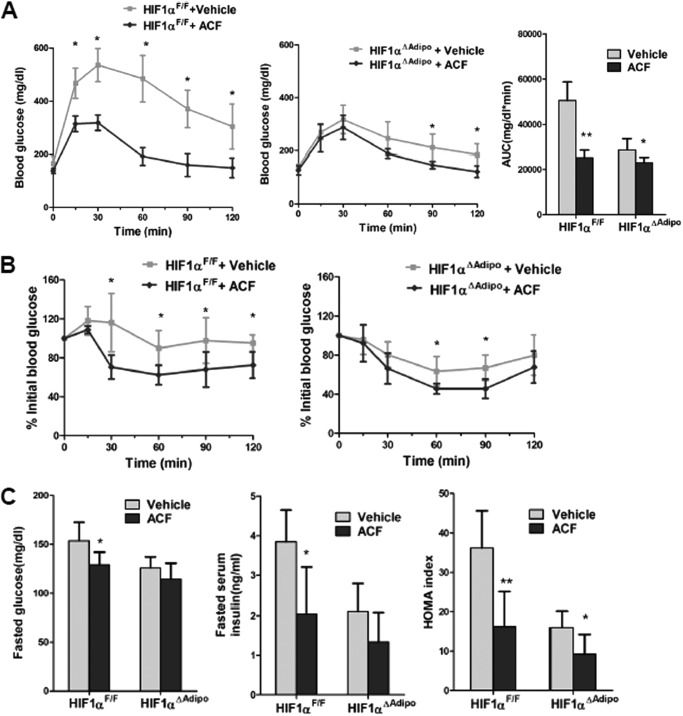
FIGURE 11.
ACF treatment improves insulin sensitivity partly through adipose HIF1α. A, blood glucose levels in GTT and the area under the curve (AUC) after 11 weeks of treatment. B, ITT after 16 weeks of treatment. C, fasted glucose and fasted serum insulin levels and HOMA index (n = 5 mice per group). *, p < 0.05; **, p < 0.01 compared with vehicle-treated mice of the same genotype.

