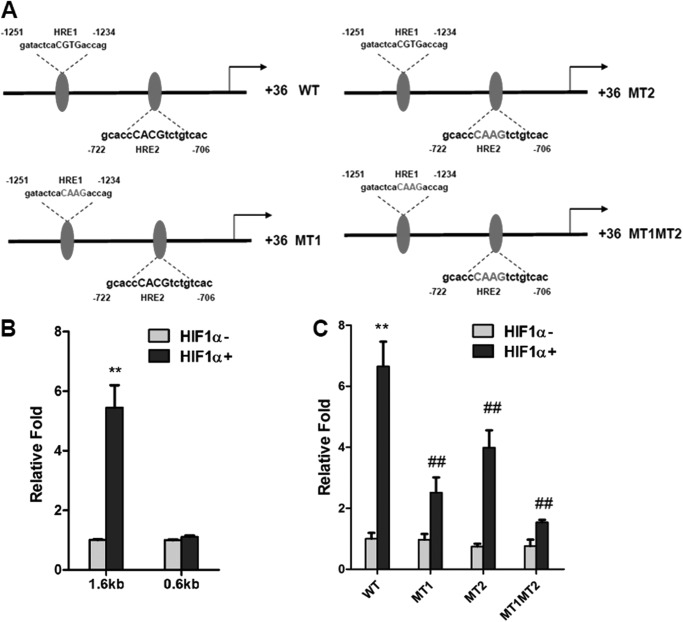
FIGURE 3.
Luciferase assays of the Socs3 promoter in response to HIF1α. A, schematic diagram of the Socs3 promoter illustrating the WT and mutant (MT) HREs. B and C, luciferase assays of Socs3 promoter activity. Adipocytes were transiently transfected with the Socs3 promoter, WT or mutant firefly luciferase constructs, and the control plasmid phRL-SV40 and cotransfected with empty vector or HIF1α expression plasmids. Each bar represents the mean ± S.D. **, p < 0.01 compared with empty vector; ##, p < 0.01 compared with the WT construct.

