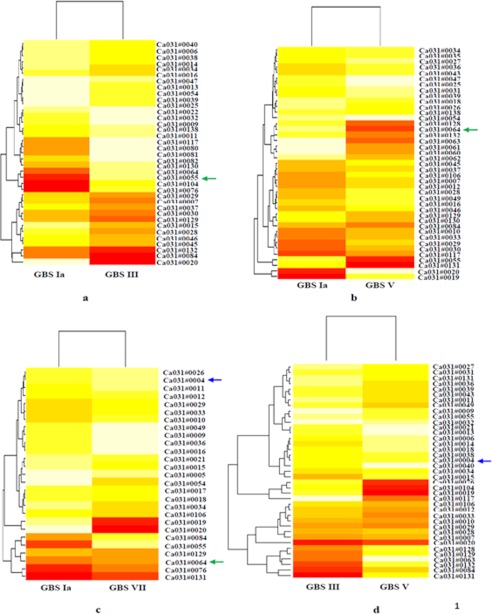
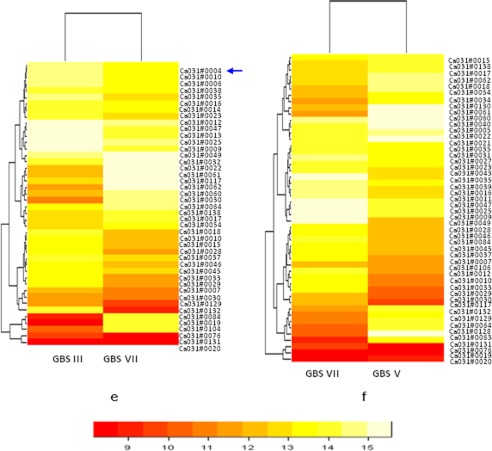
FIGURE 2.
Heat map for Ia versus III (a), V (b), and VII (c); III versus V (d); III versus VII (e); and VII versus V (f). Each oligonucleotide number represents a particular gene. The heat maps were generated for differentially expressed genes as shown in colors. The color code ranges from dark red (lowest value of intensity) to light yellow (highest value of intensity). The green arrow shows the PI-2a found commonly up-regulated in GBS type III, V, and VII, as compared with type Ia. The blue arrow indicates the PI-1 commonly up-regulated in type VII as compared with Ia and III and also in type V as compared with III. Note that for -fold change of genes that are up- and down-regulated as shown in heat maps, please see corresponding tables shown in the supplemental material.


