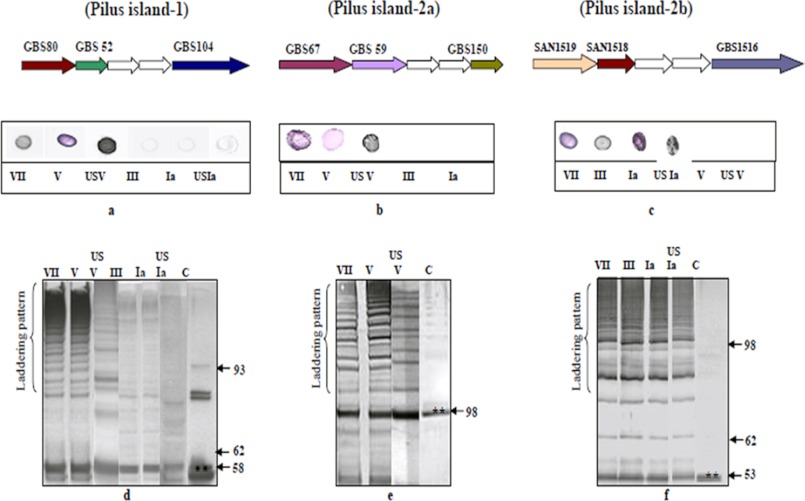
FIGURE 3.
a–c, whole cell blot assay for GBS pilus protein expression of GBS80 (a) GBS67 (b), and SAN1518 (c). The top panel shows the genetic organization of pilus proteins. Western blotting is shown in the lower panels (d–f). In each case, purified proteins were used as positive controls: rGBS80 (58 kDa, 0.025 μg), rSAN1518 (53 kDa, 0.025 μg), and rGBS67 (98 kDa, 0.025 μg). Lane M, molecular mass marker (kDa). **, control bands. Total protein extracts (10 μg) were also stained with Coomassie Blue as protein loading controls. Comparative pilus protein expression of the Indian and United States (US) types Ia and V are also shown.

