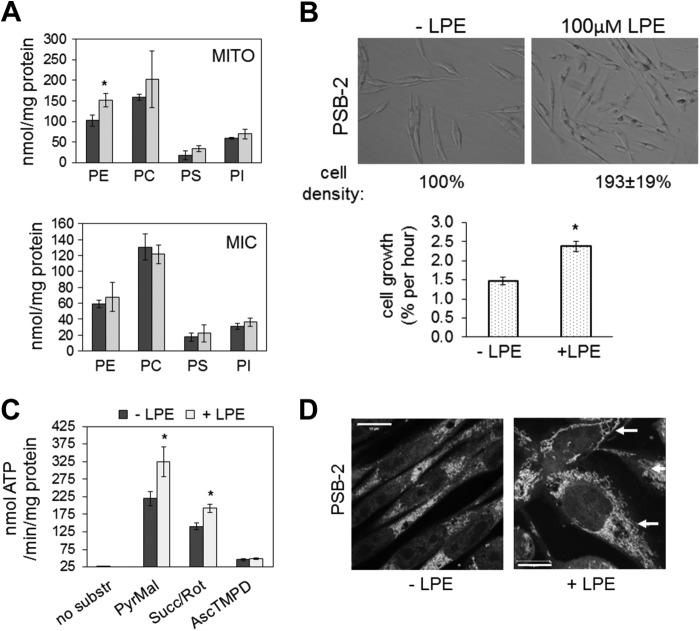
FIGURE 13.
Lyso-PE supplementation of PSB-2 cells. A, mass (nmol/mg protein) of PE, phosphatidylcholine (PC), phosphatidylinositol (PI), and PS in Percoll-purified mitochondria (MITO, upper panel) and microsomes (MIC) from PSB-2 cells grown for 96 h in medium containing 100 μm lyso-PE (LPE; light bars) or vehicle (dark bars). B, representative images of PSB-2 cells cultured for 96 h ± 100 μm lyso-PE. Graph shows growth rate of PSB-2 cells ± LPE. C, rate of ATP synthesis (from substrates in Fig. 9) in PSB-2 cells cultured with (light bars) or without (dark bars) lyso-PE. D, confocal images of MitoTracker Red-stained PSB-2 cells grown for 96 h ± lyso-PE; nuclei stained with DAPI. Arrows indicate filamentous mitochondria in cells supplemented with LPE. Data in graphs are means ± S.D. of triplicate analyses from two independent experiments (*, p < 0.05 versus control). Succ, succinate; Rot, rotenone; substr, substrate; PyrMal, pyruvate + malate; AscTMPD, ascorbate (reducing agent) + tetramethylphenylenediamine dihydrochloride.

