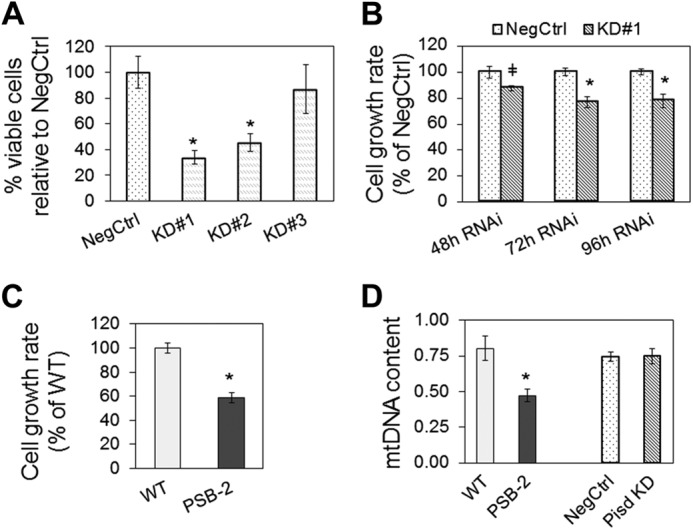
FIGURE 3.

Cell growth and mitochondrial DNA. A, number of Pisd KD#1, #2, and #3 cells relative to NegCtrl cells measured in 100–500 nuclei from five fields. B, growth rate of Pisd KD#1 cells and NegCtrl cells 48, 72, and 96 h after transfection according to a model of exponential growth. Data are means ± S.D. from three independent experiments (*, p < 0.05; ‡, p < 0.1). C, growth rate of PSB-2 cells and WT cells. Data are means ± S.D. from three independent experiments (* p < 0.05). D, ratio of mtDNA to nuclear DNA. Data are means ± S.D. from three independent experiments (*, p < 0.05 versus control).
