
FIGURE 8.
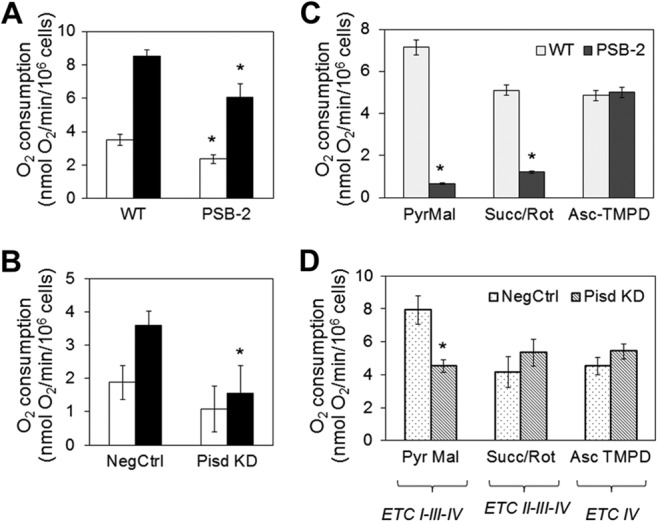
Oxygen consumption in mtPE-deficient cells. A and B, basal rate of O2 consumption in intact cells from endogenous substrates (white bars) and maximal rate of O2 consumption (black bars) measured after addition of the uncoupling agent carbonylcyanide 4-trifluoromethoxyphenylhydrazone (10 μm). C and D, substrate-driven O2 consumption in digitonin-permeabilized cells supplied with ETC substrates: PyrMal, pyruvate + malate (complex I); Succ/Rot, succinate (complex II) + rotenone (Rot, inhibitor of complex I); Asc-TMPD, ascorbate (reducing agent) + tetramethylphenylenediamine dihydrochloride (TMPD, electron donor for complex IV). Data are means ± S.D. from three experiments (*, p < 0.05 versus control).