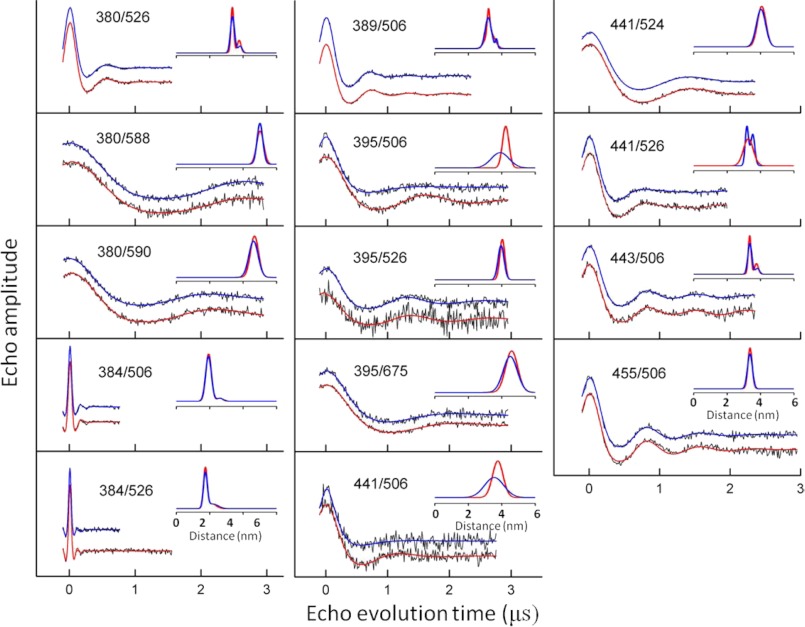
FIGURE 10.
DEER data from the other 14 interdomain DEER measurements on CBD12. The experimental data, collected as described under “Experimental Procedures,” for each pair of sites are shown as dots. The fits to the experimental data are shown as solid lines in red (saturating level of bound Ca2+) and blue (no bound Ca2+). The inset in each panel is the average distance and distribution of distances, in Å, obtained from analyses of the data. The mean distances and the distribution of distances calculated from the data analysis are reported in Table 1 of the manuscript.

