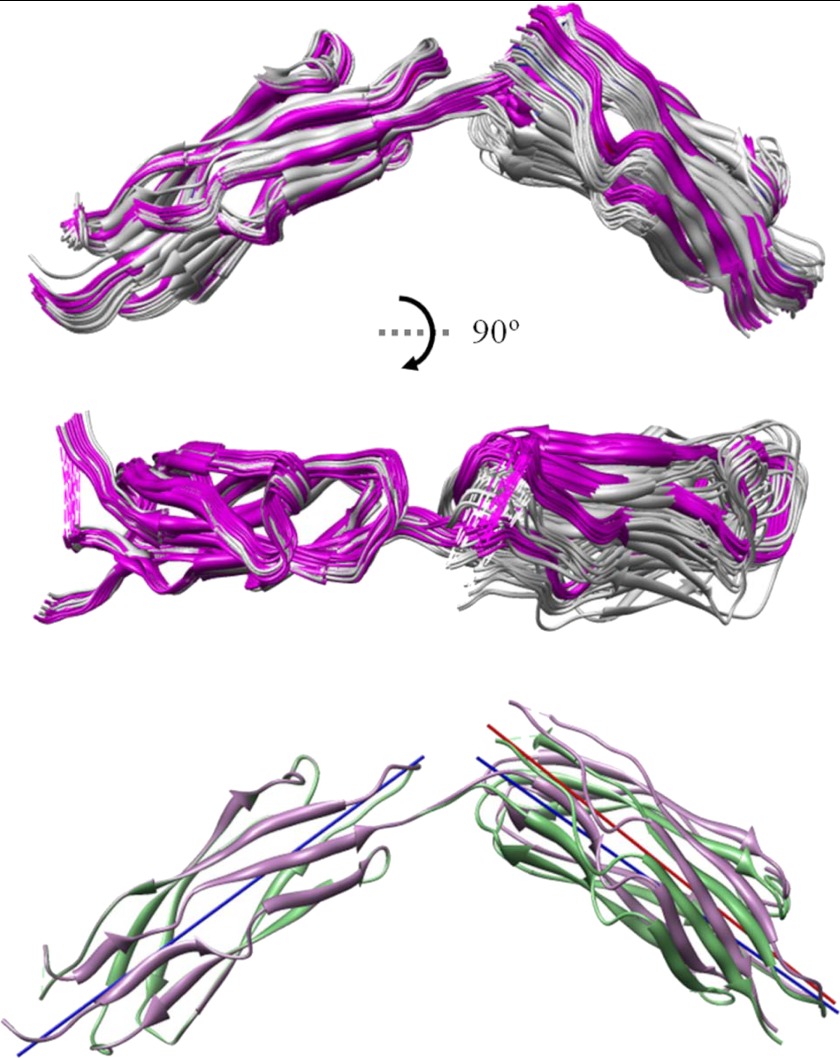
FIGURE 11.
Structural models for CBD12. The top 20 structures determined from the 17 inter-probe distances measured by DEER are shown superimposed in the upper and middle panels. The middle set of structures is rotated by 90° relative to the upper panel and show that the two CBDs lie in very nearly the same plane. The overlaid structures in white are from the Ca2+-free form (average backbone root mean square deviation of 1.28 Å), and those in magenta are from the Ca2+-bound form (average backbone root mean square deviation of 0.92 Å). In the lower panel, the average structure calculated from each set of 20 is shown. The solid blue line that bisects CBD1 in the lower panel and the solid blue and red lines that bisect CBD2 show that the angle between the two domains does not change dramatically upon Ca2+ binding. The calculated angle between the two domains is 105° (Ca2+-bound) and 109° (Ca2+-free).

