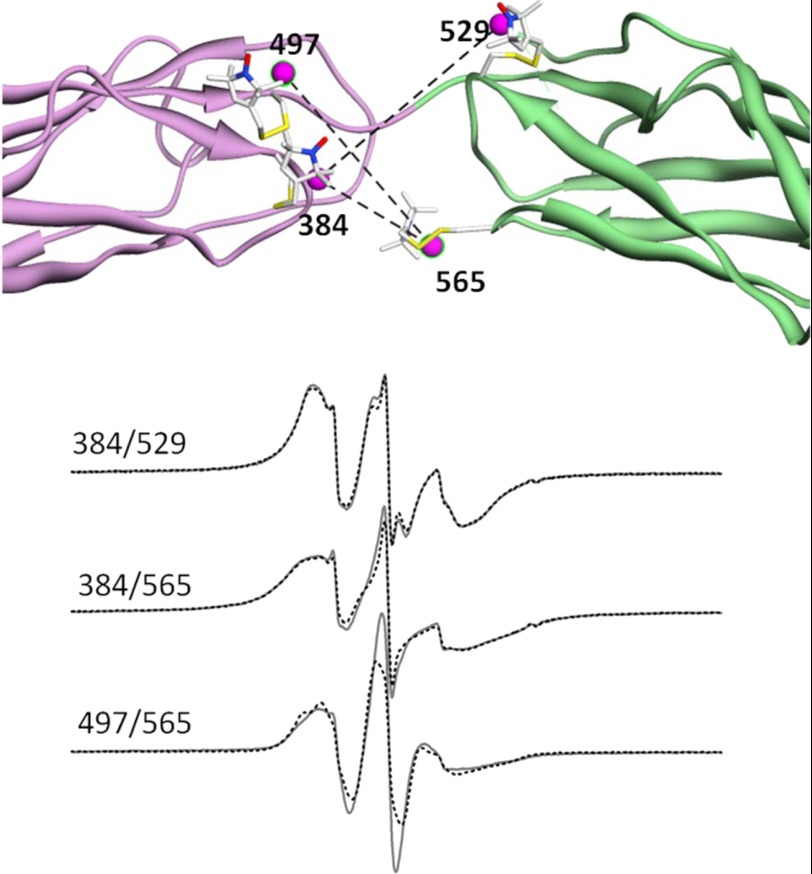
FIGURE 12.
Sites near the linker between CBD1 and CBD2 chosen for measurement of dipolar coupling. Three different pairs of sites, one on CBD1 and one on CBD2, were chosen for spin labeling that were predicted to be <20 Å from each based upon the structures presented in Fig. 9: 384/529 (upper set of EPR spectra), 384/565 (middle set of EPR spectra), and 497/565 (lower set of EPR spectra). In each set, the solid black spectra are in the presence of saturating levels of Ca2+, and the overlaid solid red spectra are in the absence of Ca2+. The magenta spheres show the midpoint of the N-O bond of the R1 side chain at each site. As shown by the EPR spectra, each chosen pair showed strong dipolar coupling that was not dependent on whether or not Ca2+ was bound.

