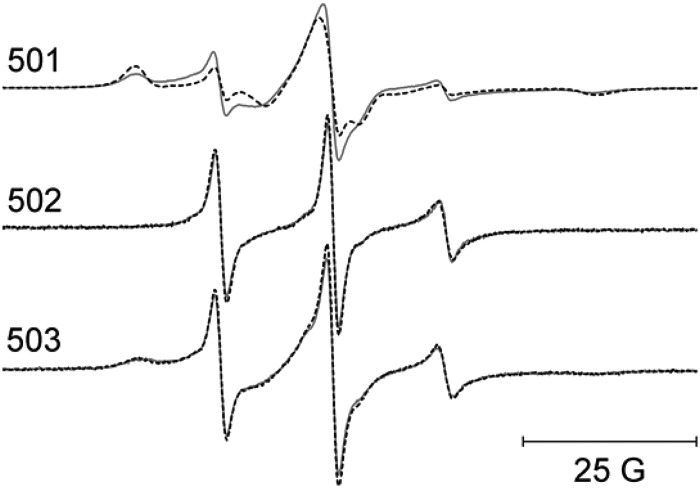
FIGURE 13.
EPR spectra from the three residues that form the short linker joining CBD1 and CBD2. The solid lines are data collected with no bound Ca2+, and the superimposed dashed lines are data collected in the presence of saturating level of Ca+2. All spectra have been normalized to the same integrated signal intensity.

