FIGURE 3.
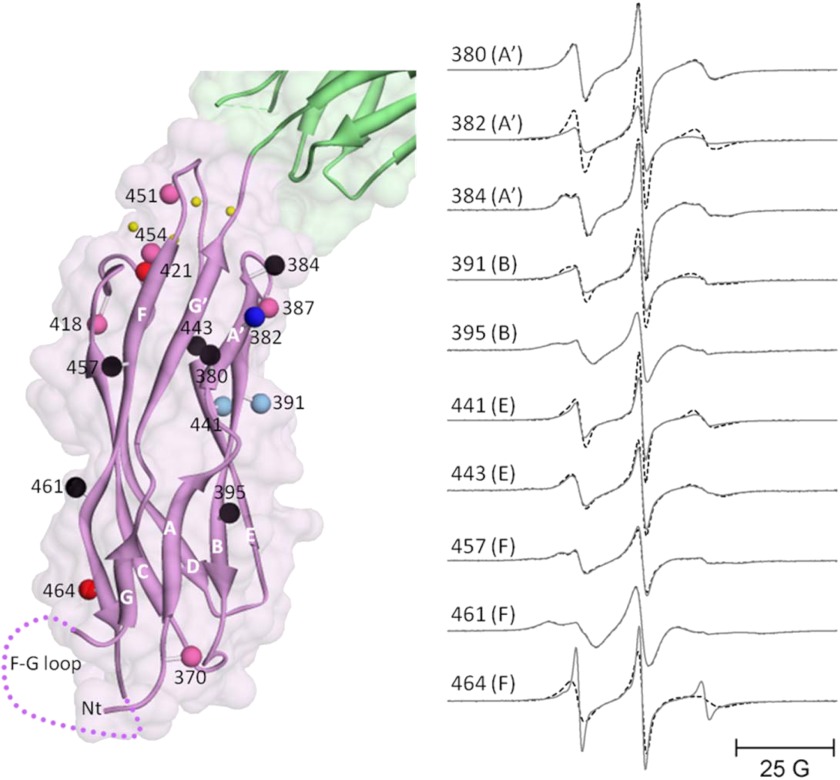
Sites selected for site-directed spin labeling in the CBD1 domain of CBD12 and their corresponding EPR spectra. The ribbon diagram of CBD1 is shown in purple superimposed on the space-filling model in the left panel (coordinates were from PDB 2DPK). The sites where single R1 spin-labeled side chains were incorporated are shown as solid spheres that are centered at the coordinates of the β-carbon of each residue. The spheres are color-coded to indicate changes in spin-labeled side chain mobility upon Ca2+ binding as follows: black, no change; bright red, substantial decrease; pale red, subtle decrease; bright blue, substantial increase; pale blue, subtle increase. The positions of the four Ca2+-binding sites are shown as small yellow spheres. The position of the F-G loop is shown schematically in dots. The green ribbon diagram and space-filling model at the top are the apical portion of the CBD2 domain. The EPR spectra in the right panel are from the surface sites in CBD1 and are shown as solid lines (no bound Ca2+) and dashed lines (saturating level of bound Ca2+). All spectra have been normalized to the same integrated signal intensity.

