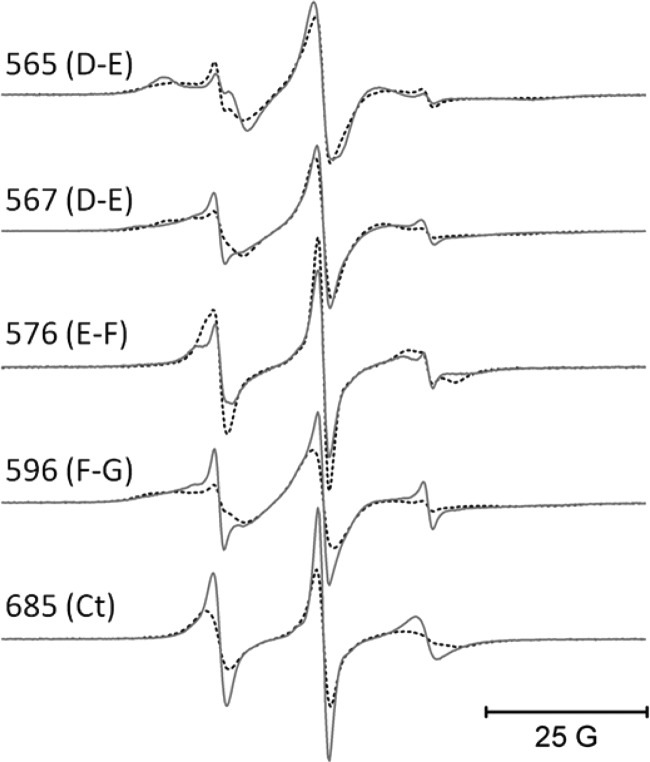
FIGURE 7.
EPR spectra from the Ca2+ binding loops, the F-G loop, and the C terminus of the CBD2 domain of CBD12. All EPR spectra were collected as described under “Experimental Procedures.” The solid lines are data collected with no bound Ca2+, and the superimposed dashed lines are data collected in the presence of a saturating level of Ca+2.

