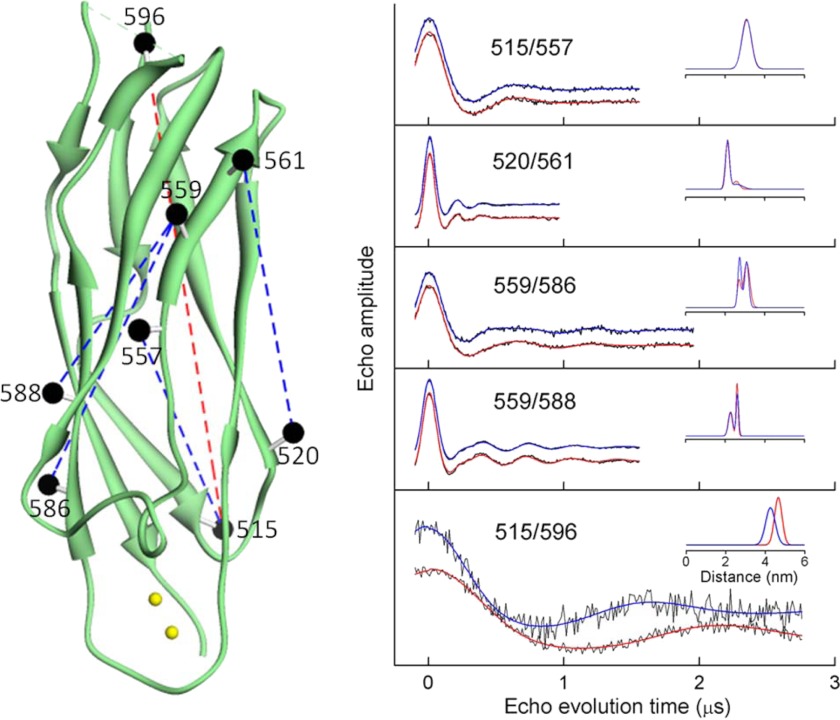
FIGURE 8.
Pairs of sites selected for site directed spin labeling in the CBD2 domain of CBD12 and their corresponding DEER spectra. The ribbon diagram of CBD2 is shown in green in the left panel (coordinates were from PDB 2QVM). The sites where pairs of R1 spin-labeled side chains were incorporated are shown as solid spheres connected by dashed lines. The spheres are centered at the coordinates of the β-carbon of each selected residue. The positions of the two Ca2+-binding sites are shown as small yellow spheres. The position of the F-G loop is shown schematically in a dashed green line. The DEER data for each of the five pairs of sites are shown as solid black lines in the right panel. The fits to the DEER data are shown as solid blue lines (no bound Ca2+) and solid red lines (saturating level of bound Ca2+). The average distances and widths of the distance distributions are shown in the insets to each DEER data set in Å.

