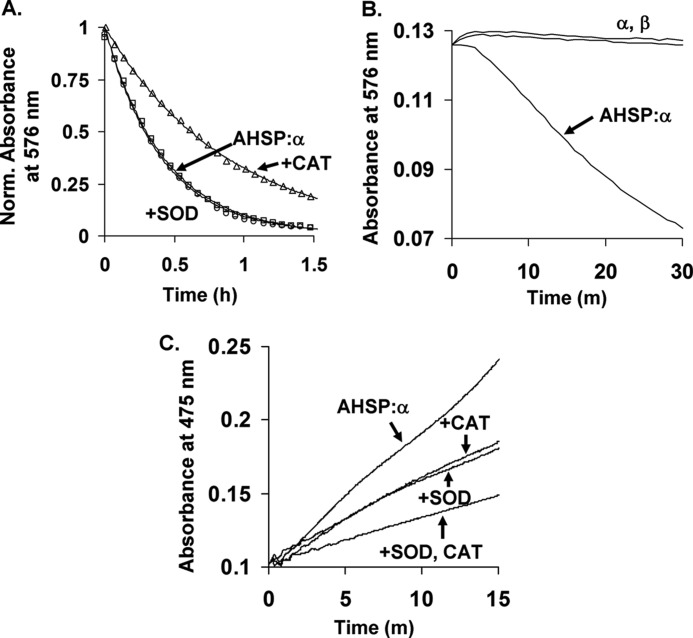
FIGURE 1.
Autooxidation and H2O2 and O2˙̄ production by AHSP·α-subunit complexes. A, representative autooxidation time courses in the absence and presence of catalase or superoxide dismutase. B, time courses for autoxidation of isolated αO2- and βO2-subunits and the AHSP·αO2 complex. C, co-oxidation of epinephrine by AHSP·αO2 in the presence of catalase or superoxide dismutase. Autooxidation was performed at 37 °C using air-equilibrated 0.05 m potassium phosphate, pH 7.0, at 37 °C, and 10 μm protein in heme equivalents. Where indicated, 10 μg/ml of superoxide dismutase (SOD) and 200 units/ml of catalase (CAT) were added prior to data collection. Co-oxidation of epinephrine was followed at 475 nm using 600 μm epinephrine and the same buffer and temperature conditions as were used for autoxidation (25). Complete time courses for isolated α and β could not be obtained due to protein precipitation. Data in panel A were normalized to total absorbance signal changes. Open circles, squares, and triangles represent data points for AHSP·α alone, AHSP·α with superoxide dismutase, and AHSP·α with catalase, respectively. Lines in panel A are theoretical fits generated using the single-exponent expression Yt = Y0 + Y1e−k1*t. Observed rate constants from four replicates performed on two different days are given in the text. Data in panels B and C were normalized to correct for slight concentration differences.

