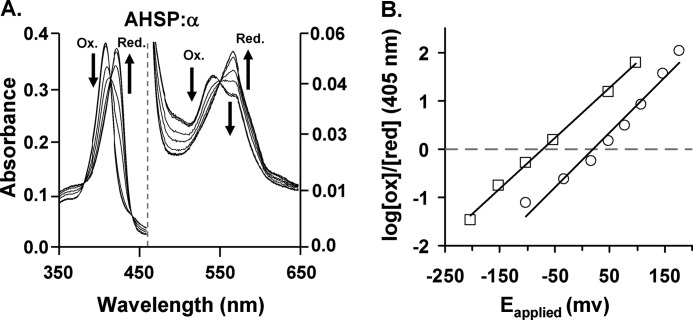
FIGURE 5.
Redox potential of AHSP·α-subunit complex. A, spectral changes in AHSP·α-subunit complexes following exposure to increasingly negative electrical potentials. The initial AHSP·(met)-α-subunit band at 413 nm shows a progressively decreasing intensity at increasingly negative potentials. These data also show a concomitant increase in absorbance at 430 nm. These transitions reflect a conversion to the ferrous oxidation state from the ferric state. AHSP·(met)-α-subunit complex spectra exhibit two hemichrome peaks at 535 and 565 nm, and the spectra of reduced complexes exhibit maxima at ∼558 nm. B, Nernst plots for AHSP·α (open square) and isolated α-subunits (open circle). The dots represent actual data points and the smooth lines are the best fit to the data sets. Data points were obtained using different absorbance data at the Soret regions at all applied potentials for different species. All spectroelectrochemical experiments were done in 1 m glycine at pH 6.0 at 8 °C, using heme concentrations of 80 μm for free α-subunits and AHSP·α-subunit complexes.

