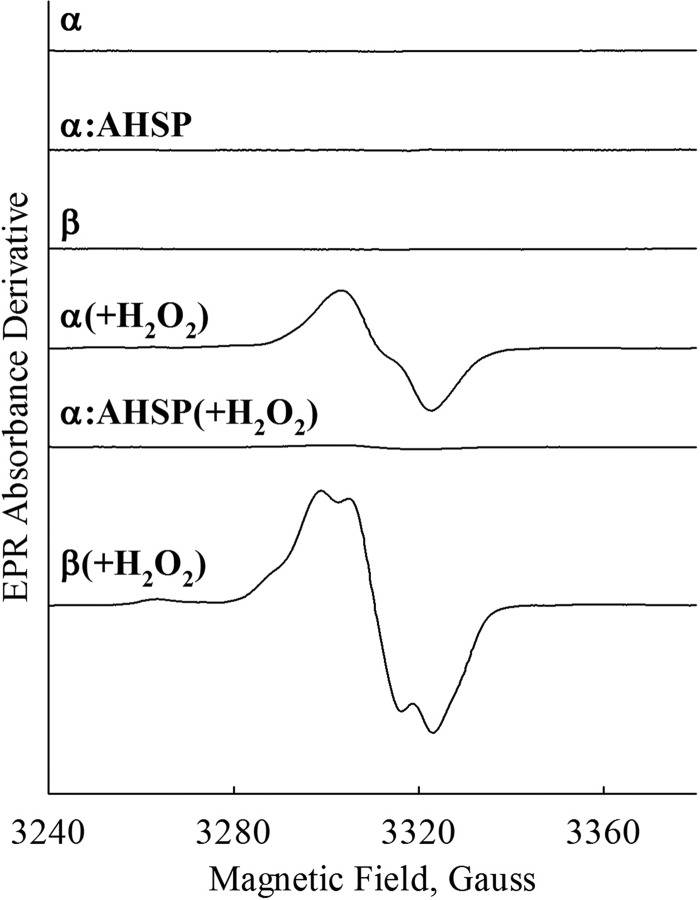
FIGURE 7.
Close-up EPR spectra of the radical species before and after H2O2 treatment. Individual spectra are labeled accordingly. EPR conditions were: microwave power, 1 milliwatt; microwave frequency, 9.3 GHz; range 140 G; modulation amplitude, 2 G; temperature, 20 K. Spectra were measured using the same samples as were used to generate the data in Fig. 6.

