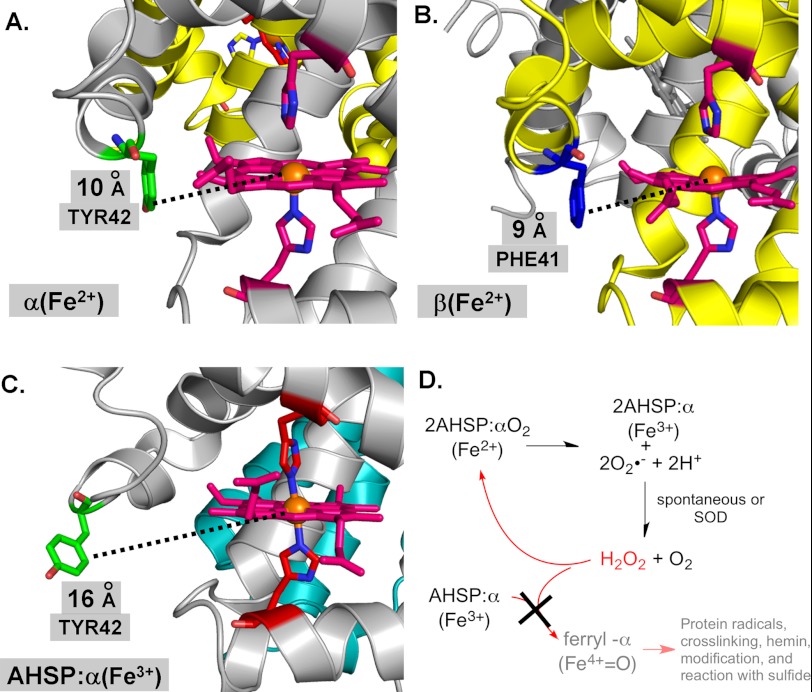
FIGURE 8.
Model structure of ferrous α-subunit, β-subunit, and ferric AHSP·α-subunit complex and oxidation reactions at the heme vicinity. A, α-subunit. B, β-subunit. C, AHSP·α-subunit complex. D, oxidation scheme. AHSP, α-subunit, and β-subunit structures are shown as ribbons in cyan, silver, and gold, respectively. Heme or heme groups are shown using pink stick structures, with αTyr-42 and βPhe-41 sticks shown in green and blue, respectively. Distal and proximal histidines are also shown using stick structures. Corey-Pauling-Koltun coloring is otherwise used throughout. Structure images were created using the PyMOL Molecular Graphics System and PDB files 1Z8U and 1HHO (15, 58).

