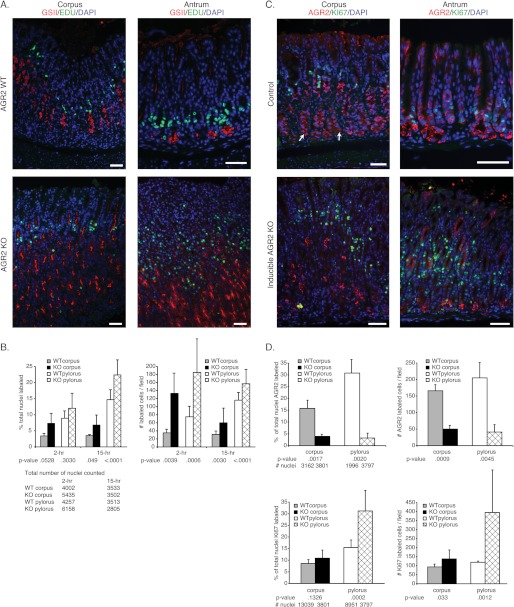
FIGURE 6.
Determination of cell proliferation in constitutive and inducible Agr2 KO mice. A, shown is labeling of the corpus (left) and antrum (right) of Agr2 WT (top panel) and Agr2 KO (bottom panel) mice with GSII lectin (red) and EdU (green) for proliferation. Tissue was harvested 2 and 15 h after EdU administration. Note that the bulk of EdU labeling is above the GSII layer, which is consistent with the isthmus layer. B, shown is quantitation of proliferating cells 2 and 15 h post-EdU labeling by counting EdU labeled cells as a percentage of the total number of nuclei (left graph). The total nuclei number is listed below the chart. The absolute number of EdU labeled cells per microscopic field (∼590 μm of mucosal length/field) was also plotted (right graph). C, shown is labeling of the corpus (left) and antrum (right) for AGR2 (red) and the proliferation marker Ki-67 (green) of 8-week-old tamoxifen-treated Agr2LoxP/LoxP (top) and Agr2LoxP/LoxP:CMV-CreERT2 (inducible KO, bottom) mice. The white arrows indicate representative AGR2-positive cells at the gland base. D, shown is quantitation of AGR2 (top graphs)- and Ki-67 (bottom graphs)-labeled cells in the inducible Agr2 KO mouse as a percentage of the total nuclei number (left graphs) or the absolute number of labeled cells per field (right graphs). The total number of nuclei counted is listed below the left graph. Error bars for all charts represent ± 1 S.D. Nuclei are stained blue with DAPI in all the immunofluorescence images. All scale bars represent 50 μm.

