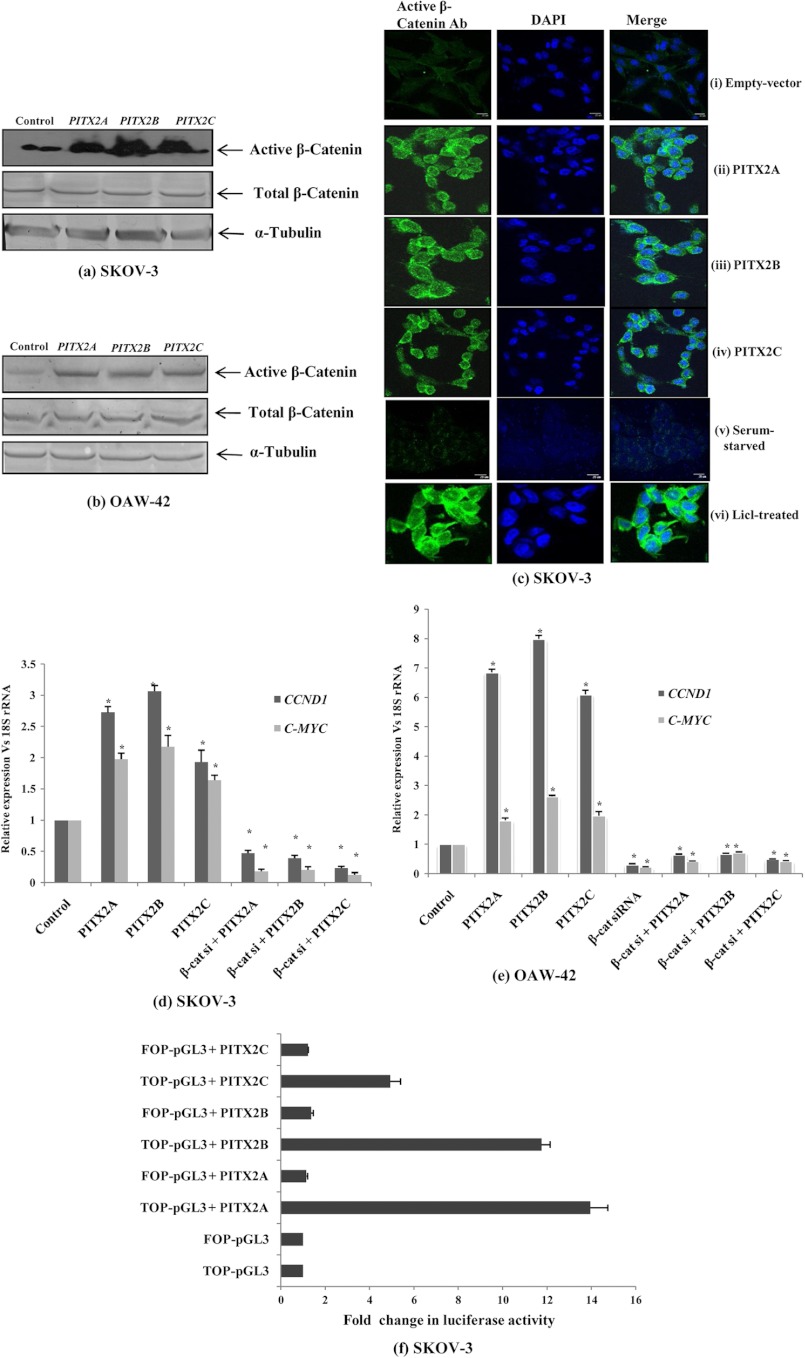
FIGURE 4.
PITX2 activates Wnt/β-catenin signaling pathway in ovarian cancer cells. 1 μg of each PITX2 isoform is transfected individually into the SKOV-3 (a) and OAW-42 (b) cells seeded on a 6-well plate, and the active-β-catenin protein is detected by Western blot analysis after 24 h using specific antibody. Total β-catenin protein level is also immunodetected in cells transfected as above. α-Tubulin protein expression is used as loading control. c, confocal staining for active β-catenin is performed in SKOV-3 cells transiently transfected with either empty vector (panels i) or PITX2A (panels ii), PITX2B (panels iii), and PITX2C (panels iv) expression vectors. In addition, another set of cells is also stained which is either serum-starved (panels v) or treated with 20 mm LiCl (panels vi). The left panel shows the images of cells stained with anti-active β-catenin antibody (Ab) followed by anti-rabbit Alexa-Fluor 488 (green). The nuclei are stained with DAPI (middle panel), and the right panel shows the merged image. The images are taken at the same exposure time. Scale bar, 20 μm. The expression level of CCND1 and c-MYC genes are quantified by Q-PCR assay after PITX2 overexpression alone or in combination with β-catenin siRNA transfection into SKOV-3 (d) and OAW-42 (e) cells, and the comparative expression of respective genes is shown as relative “fold” change (mean ± S.E.). Here, empty vector (pcDNA3.1)-transfected cells are referred to as control cells. f, SKOV-3 cells are co-transfected with TOP-Flash- or FOP-Flash-pGL3 vector, and PITX2A, -B, and -C, and luciferase activity is measured in the respective cell lysates. The activities, after normalization with pRL-CMV reporter, are shown as mean fold change compared with the TOP-pGL3 vector without PITX2 expression (mean ± S.E. from three independent experiments). * represents p < 0.05.

