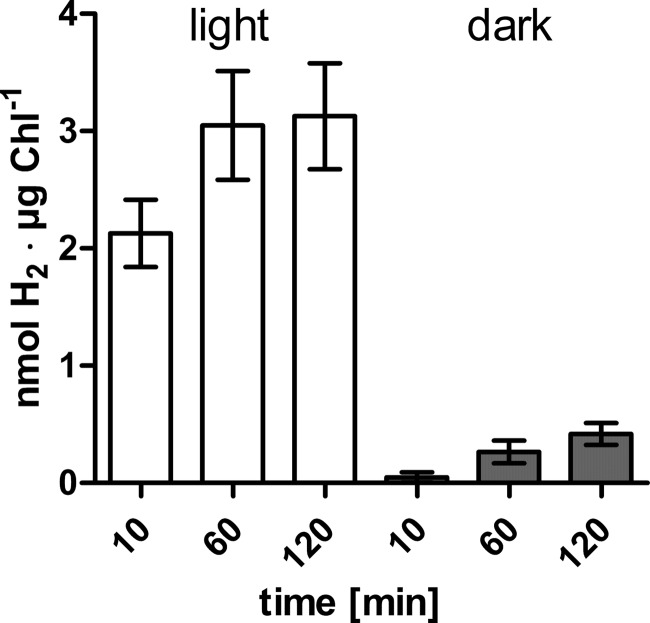
FIGURE 1.
In vivo H2 evolution rates of C. reinhardtii cultures in the light or in the dark. Concentrated cell suspensions were flushed with nitrogen for 4 h until they had reached an in vitro hydrogenase activity of 109 ± 18 nmol of H2·μg Chl−1·h−1. Then culture aliquots were withdrawn, transferred to gas tight head space bottles, and incubated in the light (white bars) or the dark (gray bars) until the indicated time points before determining the H2 concentration of the head space by gas chromatography. The results shown are the mean values from three independent experiments carried out as technical duplicates. The error bars indicate the standard deviation.

