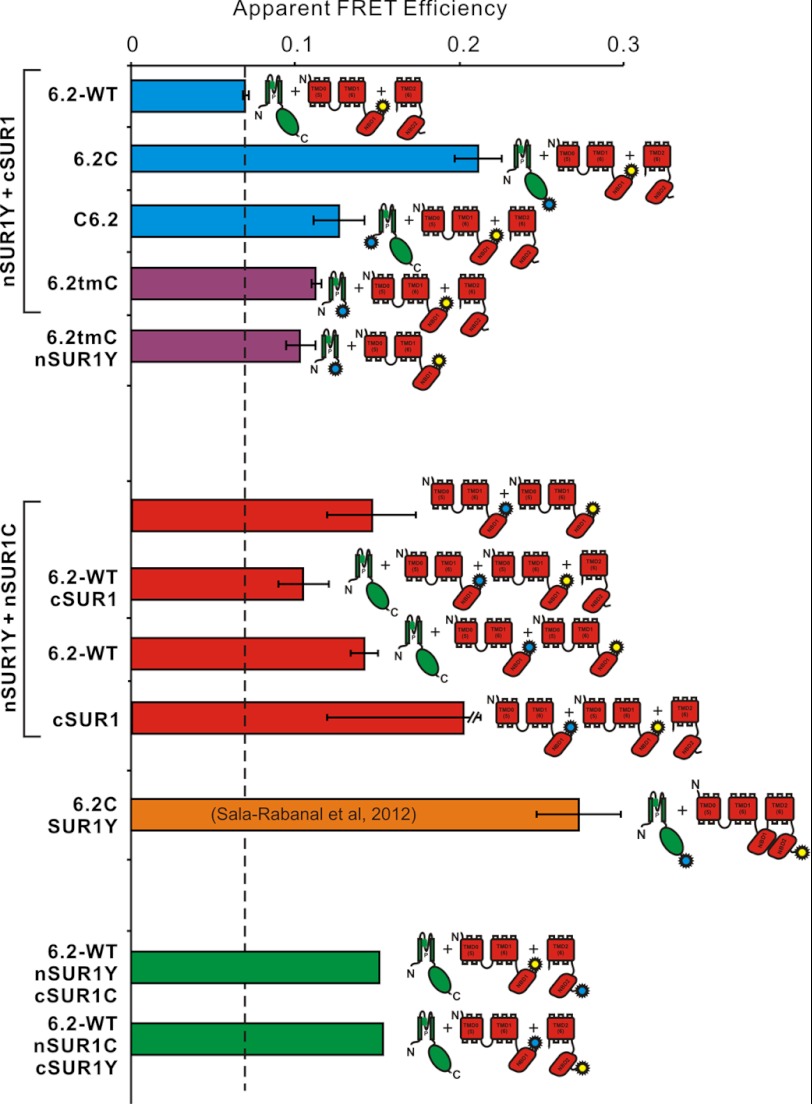
FIGURE 6.
Apparent FRET efficiencies between tagged Kir6.2 and SUR1subunits. Apparent FRET efficiency between nSUR1Y and different tagged and untagged Kir6.2 subunits (top), between nSUR1C and nSUR1Y with additional untagged subunits (center), between Kir6.2C and full-length SUR1Y (below, from Ref. 40), and between nSUR1Y and cSUR1C (bottom). CFP- and YFP-tagged DNA constructs were expressed at 1:1 ratio in each case. All of the data are presented as the means ± S.E. with n = 3–5, except for nSUR1Y/cSUR1C mixtures (average of n = 2).

