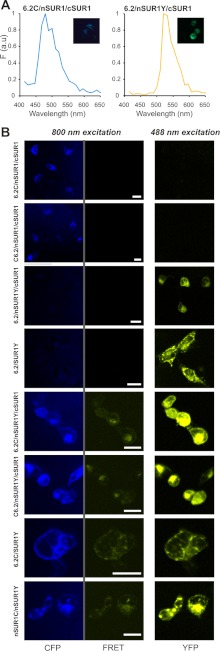
FIGURE 7.
Construct localization and FRET signals in living cells. A, CFP and YFP emission spectra acquired for fingerprinting imaging were obtained from COSm6 cells transfected with constructs containing only CFP or YFP fusion tags. B, FRET examination on living cells using fingerprinting imaging. COSm6 cells transfected with different plasmid sets were excited by 800 nm, and emission spectra from 441 to 602 nm were imaged pixel by pixel with a beam splitter HFT-KP650. The fluorescence emission from CFP (marked as CFP) and sensitized emission from YFP caused by FRET (marked as FRET) were separated by linearly unmixing using standard CFP and YFP spectra obtained in A. The YFP emission (marked as YFP) was imaged separately using a 488-nm laser. The scale bars in the middle panels are 20 μm. All of the cells were imaged and displayed under identical configurations.

