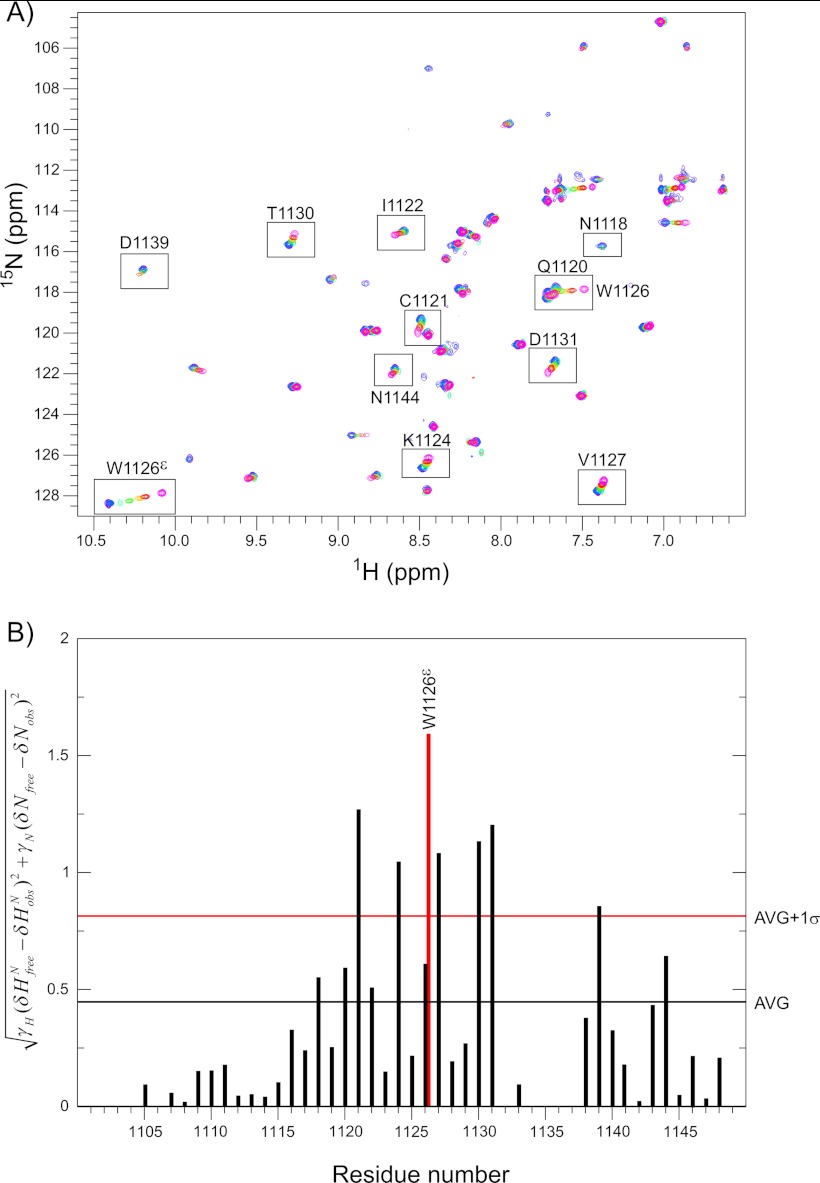
FIGURE 5.
1H,15N HSQC titration and chemical shift perturbation of CR10h with gentamicin. A, overlay of seven 1H,15N HSQC spectra with varying gentamicin concentrations. The spectra of 0 μm, 280 μm, 500 μm, 1 mm, 2 mm, 5 mm, and 10 mm gentamicin are shown in pink, red, yellow, green, cyan, blue, and purple, respectively. Residues perturbed above average are boxed and labeled. The peaks of Glu-1120 and Trp-1126 are shown in the same box. B, the per residue calculated chemical shift perturbation when comparing 0 and 10 mm gentamicin are plotted for CR10h. The perturbation for the Trp-1126 indole Nϵ is shown in red. The horizontal black and red bars illustrate the average (AVG) and the average plus 1 S.D. (AVG+1σ).

