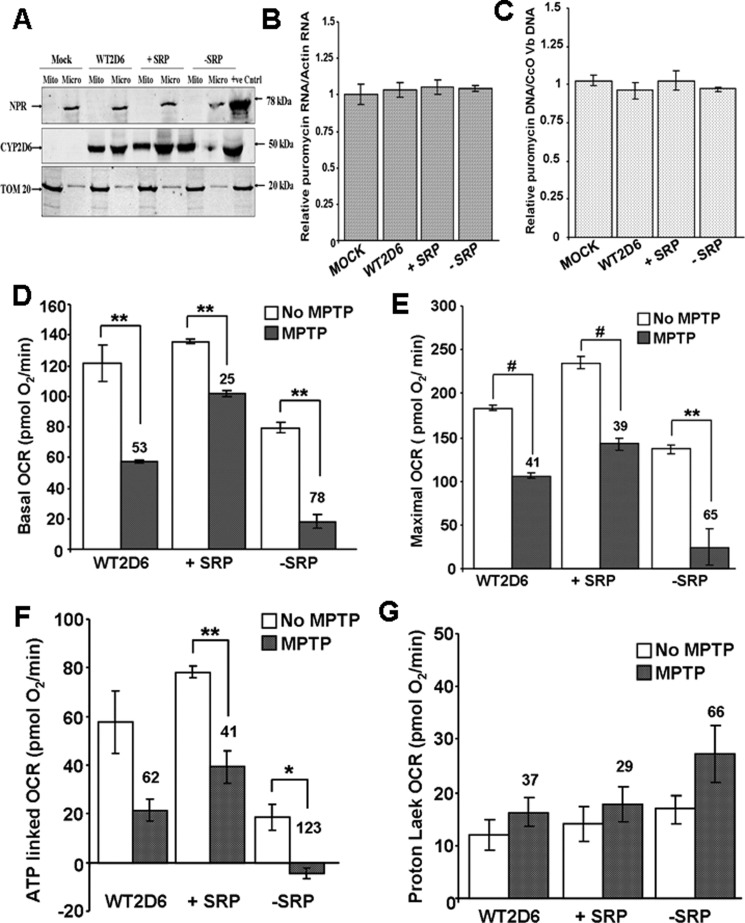
FIGURE 3.
Effects of MPTP on Neuro-2A cells stably expressing different CYP2D6 cDNA constructs. A, mitochondrial (Mito) and microsomal (Micro) isolates from Neuro-2A cells stably transduced with adenoviral vector with cloned WT, −SRP, and +SRP CYP2D6 cDNAs were subjected to immunoblot analysis; 30 μg of protein was run in each lane. The blot was co-developed with NPR antibody and TOM20 antibody. B and C, relative levels of puromycin acetyltransferase mRNA, which is the selection marker for the isolation of transduced cells, and the levels of integrated puromycin acetyltransferase gene were quantified to assess the levels of integration of vector DNA in each cell line. Actin mRNA level was used as internal control for mRNA levels, and CcO Vb gene was used as internal control for DNA level. D–G, respiration profile was measured in 25,000 cells using Seahorse Bioscience XF24 extracellular analyzer. All parameters were analyzed using XF software and displayed as oxygen consumption rates (pmol O2/min/well). D, basal OCR accounts for base-line rates of oxygen consumption. Oligomycin (2 μg/ml), DNP (40 μm), and rotenone (1 μm) were injected through ports A–C respectively. E, DNP-mediated uncoupling generates maximal OCR. F and G, inhibition by oligomycin and rotenone corresponds to ATP-linked OCR and proton leak, respectively. The number above the bar in the histogram indicates % inhibition or elevation. Mean values ± S.D. were calculated based on three separate measurements. ** denotes p < 0.05; # denotes p < 0.001.

