
FIG. 5.
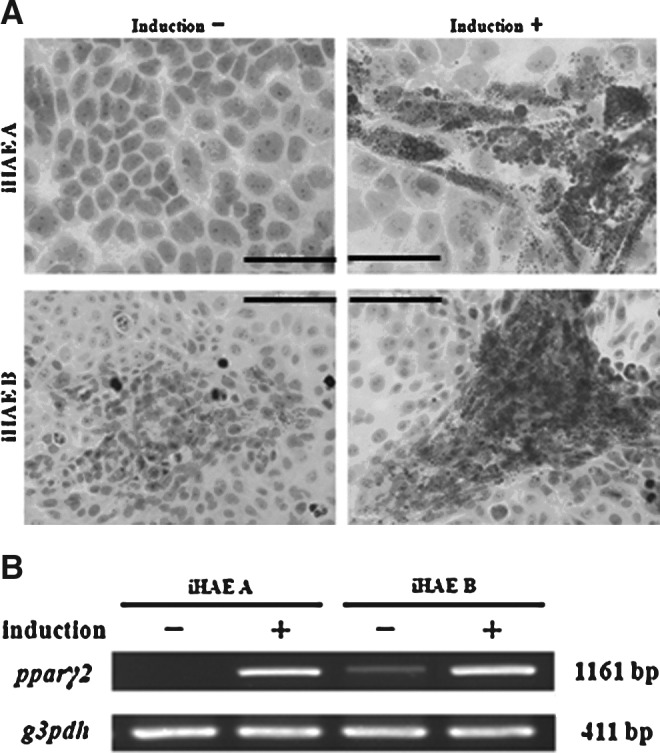
Adipogenic differentiation of the two iHAE cell lines. (A) Oil Red O staining of iHAE A and B cells with or without adipogenic induction. (Upper left) iHAE A cells without induction; (upper right) iHAE A cells with induction; (lower left) iHAE B cells without induction; (lower right) iHAE B cells with induction. Scale bar, 100 μm. (B) RT-PCR of PPARγ2 mRNA (an adipogenic differentiation marker) from iHAE A and iHAE B cells with (+) or without (−) adipogenic differentiation.