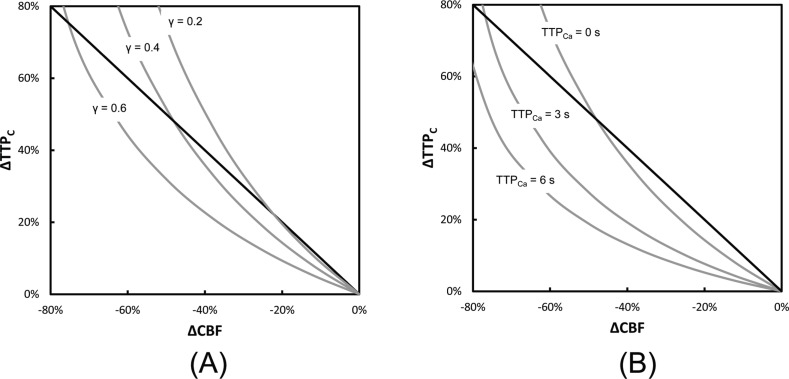
Fig. 2.
The relationship between changes in tissue-curve TTP (ΔTTPC) and changes in CBF (ΔCBF) (grey lines). (A) The effect of varying the relationship between CBV and CBF, which was performed using the Grubb relationship for γ = 0.2, 0.4 and 0.6, and setting TTPCa = 0. (B) The effect of varying the arterial TTP (TTPCa) from 0 to 6 s with γ set to 0.38. The solid lines show the negative unity slope for comparison.

