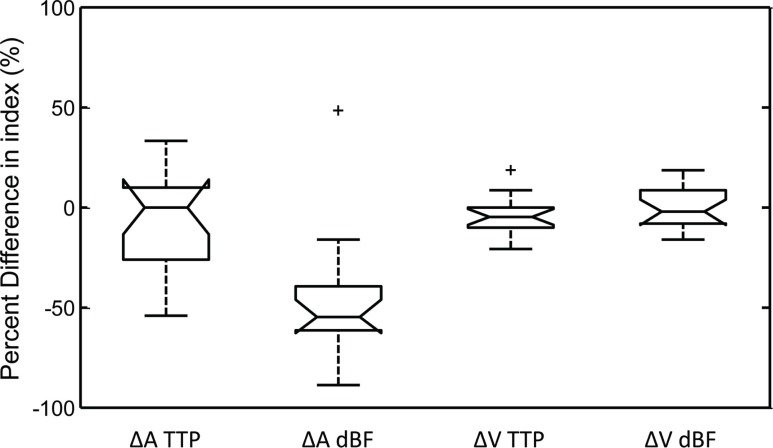
Fig. 4.
Box-and-whisker plot of the difference in measured blood flow indices during the extracerebral manipulations compared to measurements acquired on the brain. Each parameter was evaluated from seventeen measurements acquired in four pigs. Boxes are bound by 1st and 3rd quartiles, with the centre line indicating the median. Error bars represent the range of the data, and crosses signify outliers. Only ΔA dBF was significantly different from the expected change of zero (p < 0.001). Additionally, none of ΔA TTP, ΔV TTP, or ΔV dBF differed significantly from each another, as measured by a paired t-test.

