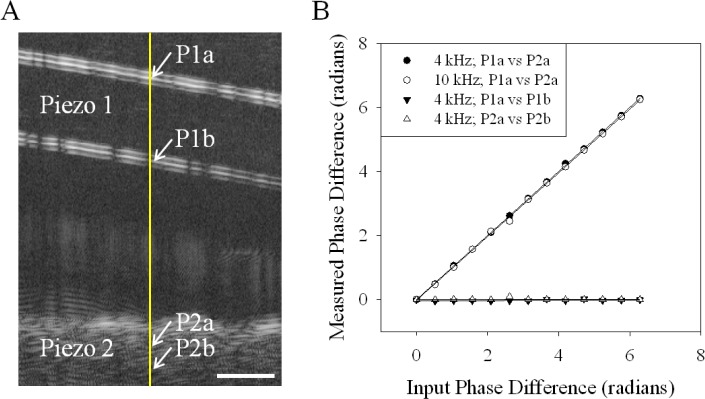
Fig. 3.
(A) A B-scan image of the 2 piezo-electric membrane setup. Piezo 1 labels the transparent plastic that was attached to one piezo-electric membrane. Piezo 2 labels the tape atop the second piezo-electric membrane. The A-line that was recorded from is highlighted by the yellow line. The depths that were compared are indicated by white arrows and labeled P1a, P1b, P2a, and P2b. The scale bar is 200 µm. (B) The measured phase difference at two different depths plotted against the input phase difference to the two piezo-electric membranes at 4 or 10 kHz. 4 kHz; P1a vs P2a refers to a comparison between the labeled depths. The equation of the linear fit was y = 1.0015(x) – 0.0002 and the R2 value was 0.99. 10 kHz; P1a vs P2a refers to a comparison between the labeled depths. The equation of the linear fit was y = 0.996(x) – 0.0243 and the R2 value was 0.99. 4 kHz; P1a vs P1b refers to a comparison between the labeled depths. The equation of the linear fit was y = 0.0048(x) – 0.0425 and the R2 value was 0.18. 4 kHz; P2a vs P2b refers to a comparison between the labeled depths. The equation of the linear fit was y = −0.0005(x) + 0.0084 and the R2 value was 0.0013.

