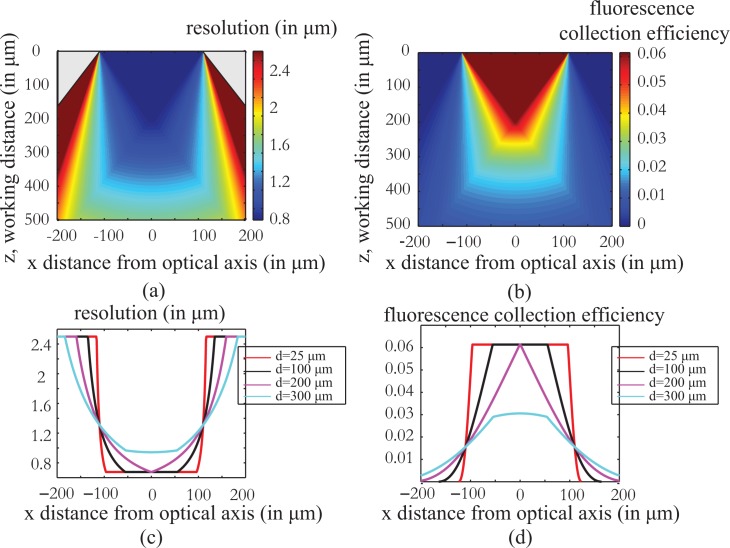
Fig. 2.
Resolution and fluorescence collection efficiency of the fiber endoscope as a function of working distance z and the distance from the optical axis of the system x as calculated using a geometrical optics analysis (Appendix A). The calculations are done for a 220μm diameter, 0.53 NA fiber. As shown in Fig. 2(a) and (c), the resolving power of the imaging system becomes worse as the imaging plane is set away from the fiber tip while at the same time, the useful field of view increases. indicate a clear trade off between resolution and field of view. Fig 2 (b), (d) present the fluorescence collection efficiency of the imaging system as a function of position. The efficiency is worse as the fluorophore is placed away from the fiber facet and towards the edges of the field of view. The simulations can help us predict the behavior of the system and correct any differences in the fluorescent levels of the final image.

