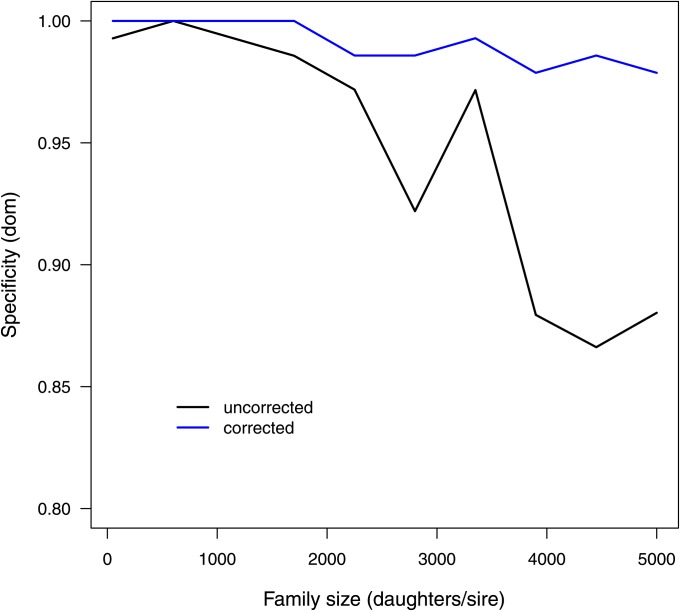
Figure 3 .
Graphical representation of the specificity to detect dominance effects as obtained from the multimarker simulation scenario. Compared are the specificities conditional on family size (daughters per sire) without any correction for relatedness (black) and after correction applying a linear mixed model (blue).

