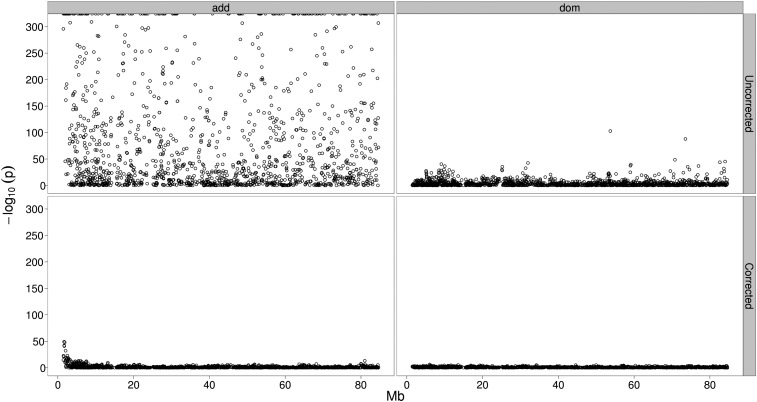
Figure 4 .
Analysis of BTA14 for the trait milk yield in a real data set comprising 469,454 cows. The y-axis represents the negative decadic logarithm of the P-values for the additive (left) and dominance (right) effects after Bonferroni correction. The x-axis gives the position on BTA14 in megabase pairs according to genome build UMD 3.1. The top panel represents the results without correction. Especially for the additive effects, there is a striking lack of specificity. The bottom panel depicts the results obtained by applying mixed-model correction.

