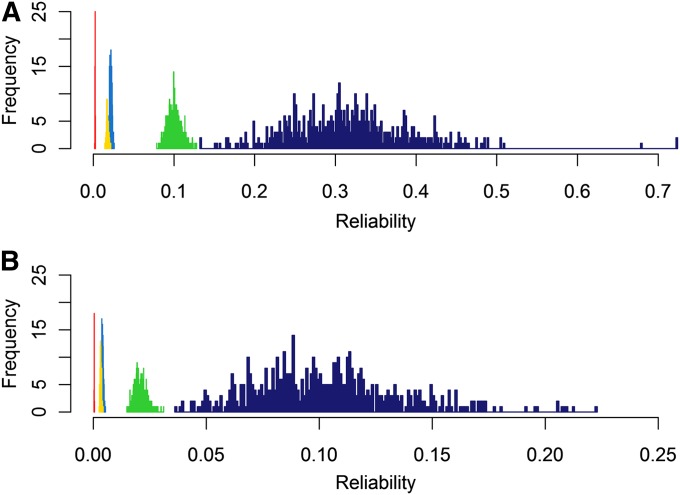
Figure 1 .
Histograms depicting distributions of reliabilities of genomic preditions using a reference population of 529 genotyped individuals at a heritability of 0.6 (A) and 0.1 (B) over the five different scenarios using different information sources from the reference population (from left to right). Red: Selection candidates simulated based on allele frequency of the reference population (FREQ). Yellow: Selection candidates simulated based on 837 haplotypes of equal length segregating in the reference population (HAP). Light blue: Selection candidates simulated based on LD pattern of the reference population (LD). Green: Selection candidates simulated based on haploid chromosomes segregating in the reference population (CHR); Dark blue: Individuals from the reference population (FAM).

