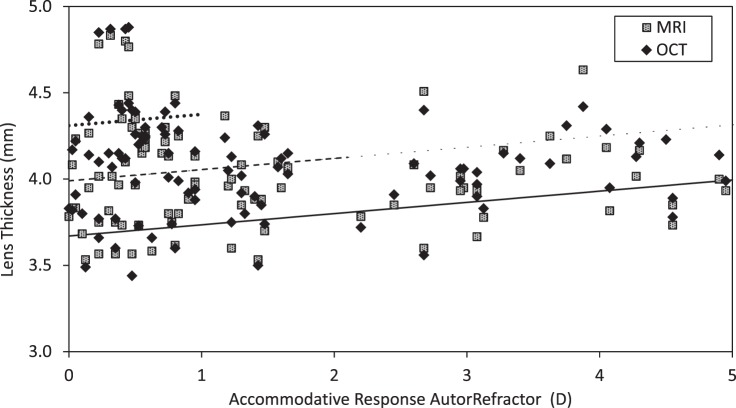
Figure 4. .
Lens thickness (LT) with accommodation. Black lines fitted to the regression equation for OCT data with age fixed at 30 years (solid line), 40 years (dashed line), and 50 years (dotted line) and 95% CI in brackets: LT by OCT (mm) = 3.67 + 0.065 × Acc Resp + 0.032 × (Age − 30) [Acc Resp = 0.057 to 0.072, Age − 0.020 to 0.043]; PAccResp < 0.001, PAge < 0.001. MRI regression equation is similar and not plotted: LT by MRI (mm) = 3.68 + 0.055 × Acc Resp + 0.028 × (Age − 30) [Acc Resp = 0.039 to 0.071, Age = 0.016 to 0.041], PAccResp < 0.001, PAge < 0.001.

